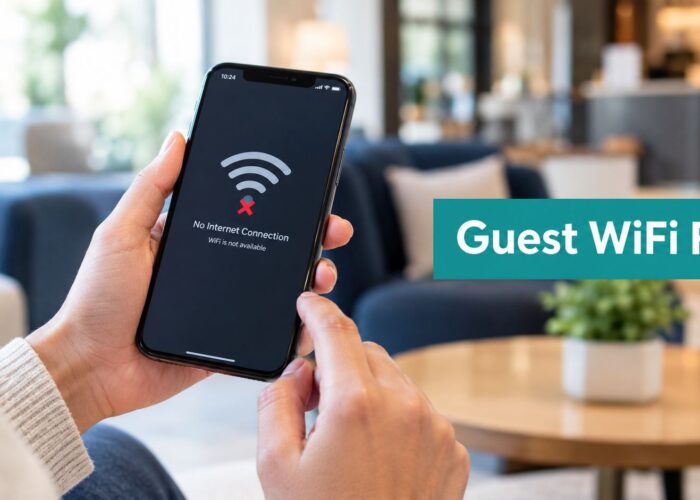
You've probably seen it on a hotel phone, a school laptop, or a retail checkout tablet. A guest taps Connect to Wi-Fi, gets dropped into a captive portal, and either gives up in frustration or signs in just to get on with the day. That tiny screen is often treated like a nuisance, but it's the first place your network can start telling you something useful about people moving through the building.
Guest Wi-Fi analytics works because it joins two kinds of signals, identity from the login flow and behavior from the network itself. The login screen tells you who chose to connect, while the access points show when devices appear, linger, return, or move between areas. That mix is what turns a basic guest network into something closer to a usable operational tool, whether you're running Cisco Meraki, managing BYOD access in an office, or trying to understand foot traffic in a lobby.

A lot of venues already have the ingredients, they just don't use them well. The captive portal can capture identity, consent, or a simple login event, and the access points can passively observe presence and movement without adding extra sensors, which is the basic idea behind treating Wi-Fi as a customer-intelligence layer rather than just connectivity guest Wi-Fi login page guidance. That matters because a hotel, a school, or a retail floor doesn't need a fantasy dashboard. It needs answers to practical questions like who came back, where they stayed, and whether the network is trustworthy enough to support a real visitor experience.
Why the Wi-Fi Login Screen Is the Most Underused Tool in Your Building
The first mistake many organizations make is seeing the captive portal as a hurdle instead of a data moment. A guest lands on a branded login page, decides whether the process feels easy, and then either moves forward or disappears. That single interaction can support both authentication solutions and analytics, especially when the portal is tied to modern guest access methods like IPSK and EasyPSK for environments that need more control than a shared password can offer.
For a hotel, that might mean a guest logs in once and later reconnects without repeating the whole dance. For a school, it might mean a student or parent uses a branded access page that separates guest traffic from internal systems. For a retail floor, the login screen can become the clean handoff point between connectivity and customer insight, especially when social login, social WiFi, or voucher-based access are part of the workflow.
The screen itself doesn't do the analysis. It feeds the analysis stack with identity, consent, and context, while the access points continue collecting behavior passively in the background user behavior tracking. That's why the portal should feel simple, not bloated. Every extra field makes the experience harder, and every unnecessary step weakens the chance that the rest of your analytics will have enough usable data to work with.
Practical rule: if the login feels annoying to a guest, it usually feels annoying to your data too.
The smartest operators treat the portal as the front door to a relationship, not a form field trap. That's where social login and social WiFi fit naturally, especially in retail and education settings where people already expect a quick sign-in and a clear reason to connect. When the portal is aligned with the way the venue works, the analytics start to become believable instead of merely decorative.
What Guest Wi-Fi Analytics Measures
Guest Wi-Fi analytics combines authenticated data and passive behavioral data. The authenticated side comes from the captive portal, where a guest might enter a name, email, phone number, voucher, or social login. The behavioral side comes from the network itself, where access points detect presence, recurring visits, dwell patterns, and movement through zones what is guest Wi-Fi analytics.
Two streams, one picture
A store greeter who counts visitors and recognizes return customers is doing two jobs at once. The count is useful, but it becomes much more useful when the greeter can tell whether someone is here for the first time or comes back every week. Wi-Fi analytics works the same way. The portal gives the system identity, and the access points give it behavior.
That combination matters because each stream has blind spots. Login-only reporting misses people who saw the splash page but never finished the form, along with guests who stayed long enough to affect operations but never converted on the portal. Raw network presence has the opposite problem, because it shows movement without context. Put the two together, and you get a clearer picture of who is in the building, how often they return, and how they move once they connect.
A hotel lobby makes the mix easy to see. A guest may sign in with an email address at the front desk, then later reconnect in the lounge without going through the full login again. The portal records that the same person authenticated, while the network records how long the device stayed near the lobby APs, whether it returned later in the day, and which zone it occupied. In a retail store, the same pattern helps staff separate a quick passerby from a shopper who lingered near fitting rooms and then came back the next day.
The most useful metrics are usually the plain ones. Footfall tells you how many visitors were present, dwell time shows engagement, visit frequency points to loyalty, and zone movement shows how people move through the space. The point is not to watch people for its own sake. It is to turn the ceiling hardware you already own into something operationally useful, while keeping in mind that placement, signal overlap, and access point design affect how much trust you should place in any one number user behavior tracking.
Why the “sensor” language matters
Vendors and analysts often describe Wi-Fi infrastructure as a sensor for visitor analytics, especially in retail, hospitality, and venues where dwell-time measurement matters. That framing helps, as long as nobody treats it like magic. The network can only detect what the radio design and the data cleaning allow it to see, and triangulation is only as good as the access point placement and the environment around it.
A practical example makes the limits clearer. In a school, a parent might authenticate through a branded guest portal, which confirms consent and identity at the edge of the network. After that, passive behavior can show whether the device remained near the reception area, moved toward the gym, or returned later for pickup. That pairing is useful because the login confirms who the session belongs to, while the movement data shows where the device spent time. It still does not mean the system knows everything about the person, and it should not be read that way.
If that sounds dry, it should not. It is the difference between guessing that a lobby is busy and knowing when people stay there. It is the difference between a marketing hunch and a network-backed signal that helps staff make a better call.
The Core Metrics Every Venue Should Care About
The words change from vendor to vendor, but the useful metrics are pretty consistent. Footfall, dwell time, repeat visits, engagement, and conversion are the ones frequently used because they map to actual decisions, not just dashboards. When those numbers are clean enough to trust, they help people answer staffing, layout, and campaign questions without hand-waving.
Footfall and dwell time in plain English
Footfall is how many real visitors were present. In a retail store, that can help a manager see whether traffic is concentrated at lunch, after work, or around a weekend event. In a hotel lobby, the same metric can help a team see whether the front desk area or lounge area is carrying more of the traffic load.
Dwell time is how long people lingered. A longer stay near a concierge desk can mean guests are asking for help, waiting for check-in, or looking for directions. A longer stay in a retail seating area can mean the space is working as intended and giving people a reason to remain in the store network performance metrics.
Repeat visits, engagement, and conversion
Repeat visits tell you who came back. That matters because loyalty is usually more useful than raw traffic, especially when you're trying to decide whether an experience is sticky or just busy.
Engagement is the simple question of whether people used the guest network, not just walked past it. Conversion is even more specific, it's whether people did the thing you wanted them to do, such as sign in, redeem a coupon, or respond to an offer. Those are different questions, and a good analytics program keeps them separate instead of collapsing them into one vague “success” number.
A metric is only useful when it leads to a decision someone will actually make.
There's a catch, though. These numbers are only trustworthy if the underlying RF design supports them. Poor AP placement, thin coverage, or noisy zones can make a simple metric look precise when it's really shaky. That's why people who talk about guest Wi-Fi analytics as if it were just a dashboard are skipping the part that makes the dashboard credible.
Where the Data Comes From
A guest Wi-Fi stack usually pulls from several places, and each one answers a different question. The wireless network gives you AP logs, the captive portal gives you login events, and some deployments add MV Sense camera analytics from Cisco Meraki smart cameras to add visual context where it helps. In a retail environment, that mix is useful when someone wants to line up foot traffic with what is happening on the floor.
The useful part is not just collecting the feeds, it is joining them in a way that makes sense. An AP can say a device was seen near a zone, the portal can say the same device accepted the terms and signed in, and a camera system can show whether that zone was busy at the time. If the venue also uses port mirroring for network traffic capture through Cisco port mirror support, network teams can inspect device activity more closely without turning the analytics stack into guesswork.
The four most common inputs
AP logs tell you presence. They show that a device was detected in the building, which is the foundation for footfall and dwell analysis.
Captive portal forms give you identity. A guest can sign in with email, phone, voucher, or a social login flow, which is where social Wi-Fi and familiar account-based access come into play.
MV Sense camera analytics can add context in Cisco Meraki environments, especially where a visual check on occupancy or flow is useful. That does not replace Wi-Fi analytics, it complements it.
Social login helps bridge convenience and identity, which is why it shows up so often in retail, hospitality, and education campaigns. It is also one reason integrations matter, because the value only shows up when the login data goes somewhere useful.
Some platforms also capture voucher printing, geo-fenced coupons, and billing gateway activity, which can matter when guest access is tied to promotions or paid access. If you want a more automation-heavy view of how that kind of data can support workflows, AI coding agents for retail is a useful example of how retailers are thinking about operational data pipelines more broadly.
There is a practical way to combine the streams. An AP might record a device MAC address and the time it appeared on a specific access point, then the portal records the same MAC after the guest submits the form. A simple join on device identifier and timestamp ties those events together, so the analyst can see that the same visitor first showed up in the RF layer and then completed the login a moment later. That is the point where the data stops being separate logs and starts looking like one record of a guest visit.
Getting Your Guest Wi-Fi Analytics Stack Off the Ground
Before the portal goes live, walk the floor with an RF survey checklist and a map of the space. Confirm where signal overlaps, where walls or shelving break coverage, and whether the guest device can be seen by enough access points to make the location layer believable. If the placement is off, the dashboard may still look busy, but the numbers behind it will be weak.
Start with the air, not the app
The first pass is physical. Check whether each high-traffic zone has stable coverage, whether the access points give the device enough visibility for location-style analysis, and whether the floor plan supports that view guest Wi-Fi venue analytics footfall. In open-plan spaces, AP spacing around 15 to 20 metres is often workable, while areas like retail checkout lanes or hospital waiting rooms usually need tighter placement Wi-Fi analytics use cases. Corridor-heavy layouts can make trilateration shaky, so the map matters as much as the software.
That limit is easy to miss. Wi-Fi can show presence and movement, but it does not turn every site into a precise tracking grid. The vendor may describe it as location intelligence, yet the quality comes from overlapping coverage, clean AP placement, and knowing which parts of the building the method can and cannot see.
Make the portal easy to trust
The captive portal should be served over HTTPS with a valid TLS certificate, and the form should post to an HTTPS endpoint guest Wi-Fi security best practices. Guests notice a login page that feels clumsy or unsafe, and corporate or BYOD users tend to notice it even faster. A clean portal does more than protect the session, it tells people the network is being handled carefully.
Progressive profiling fits well here. Ask for the minimum needed to connect, then fill in the profile later through repeat visits instead of demanding everything on the first screen guest Wi-Fi venue analytics footfall. For corporate guest access and BYOD, IPSK and EasyPSK are a better fit than one shared password because they give each user a private key without turning the whole network into a single reusable secret.
Connect the stack to action
Once the data is flowing, the next step is to send it somewhere that staff can use. Azure AD, SAML, G Suite, Mailchimp, Facebook, and Twilio can move guest identity or event data into workflows, segmentation, or follow-up messages. A real-time reporting layer from Splash Access real-time analytics reporting helps the team see what is happening while the visit is still in progress, instead of waiting until the end of the day. A network monitoring view from the UTMStack network monitoring platform also helps operations keep an eye on device health alongside the analytics side of the rollout, which matters when the same building has to support both connectivity and reporting UTMStack network device monitoring.
| Source | What It Captures | Best Used For |
|---|---|---|
| AP logs | Device presence and movement | Footfall and dwell analysis |
| Captive portal | Identity and consent | Guest authentication and CRM workflows |
| Social login | Familiar account-based sign-in | Fast guest onboarding and remarketing |
| MV Sense cameras | Visual context in supported environments | Occupancy and flow confirmation |
Privacy, Compliance, and the Case for Collecting Less
A guest Wi-Fi program can collect more than it should very quickly. That sounds useful until guests start feeling watched, legal exposure grows, and the trust behind the analytics starts to weaken. The cleaner path is to collect only what supports a real operational decision, then explain that choice plainly at the login screen and in the policy language around it.
Privacy-by-design isn't a blocker
A separate SSID that stays isolated from the business network at the routing layer is basic hygiene, not a nice-to-have. Guest traffic should leave through its own path, or at minimum through a firewall that blocks lateral movement into the LAN, as noted earlier. On the portal side, HTTPS and visible consent controls make the exchange easier to understand and less intrusive.
That matters because guest analytics is not a license to gather every possible signal. A venue can still ask for identity, consent, and a few behavior markers that help with staffing or layout decisions while avoiding a grab-bag approach to data collection. Guest Wi-Fi security best practices and privacy guidance point in the same direction, use opt-in controls, show a clear privacy policy, and keep documented retention rules in place so the system is easier to defend if anyone asks how it works guest Wi-Fi security best practices guest Wi-Fi transforms business insights.
Collect less, manage better
If the venue does not need browsing history, DNS queries, or application usage, leave them out. That is not a compromise. It is a stronger boundary, and it makes the purpose of the system easier to explain to guests and auditors.
The same logic applies to retention. A practical policy should spell out how long contact data is kept, how long behavioral data is kept, and who can access each field. For GDPR, that also means keeping consent logs that show when a guest agreed, what they agreed to, and how they were told their data would be used. A simple retention template helps here, for example, keep contact details only for the active consent period, keep behavioral logs only as long as the stated operational need, then delete or anonymize them on schedule.
A privacy-first program is usually easier to run because everyone knows where the line is. No one has to guess whether a field in the portal exists for analytics or just because marketing wanted one more checkbox.

Collect only what you need, and make that decision visible. That approach does not weaken guest Wi-Fi analytics. It makes the signals more credible, because the people behind the data can understand the terms under which the data exists.
How Different Venues Use the Same Data Differently
A hotel, a school, and a retail floor can all look at the same Wi-Fi feed and ask completely different questions. That's why a one-size-fits-all dashboard usually disappoints people. The metrics are shared, but the decisions are not.
Hospitality
In hospitality, dwell time near the breakfast bar, lobby, or concierge area can shape how the venue sets up service points and timing for guest communication. Geo-fenced offers make sense here because guests are already on property, and the network can help time messages around observable behavior. A hotel team often cares less about raw traffic and more about whether the stay feels smooth enough that people return or recommend the property.
Education
In education, the same data supports a different set of questions. A campus team may want to know how full the common rooms are later in the afternoon, whether students are returning to the library after midterms, or how guest access should be separated from dorm networks. That's one place where IPSK and EasyPSK matter, because student and corporate guest traffic shouldn't rely on a single shared password.
Retail
Retail teams usually speak in footfall, repeat visits, and conversion, so the Wi-Fi language can line up with the language they already use. Social Wi-Fi logins can route contacts into Mailchimp or Facebook audiences, which makes remarketing easier without forcing the store team to build a separate data process. Cisco Meraki environments often fit this model well because the guest experience and network layer are already close together, and the analytics can sit near the access flow instead of bolted on later.
Use the same signal, but change the question. That's the difference between a generic report and a useful one.
Measuring ROI Without Guesswork
ROI gets clearer when the measurement starts with a narrow question. Start with the revenue influenced by the guest Wi-Fi program, subtract the program cost, then divide by the program cost. A simple worked example makes that concrete. If a hotel spends $2,000/month on the analytics stack and sees a 5% increase in direct bookings worth $3,000, the ROI is 50%. After that, check three dashboard signals, repeat visit lift, dwell time uplift, and conversion change, and ask whether they support the story the numbers are trying to tell.
The rest is discipline. Run the RF survey first so the access points are placed with the room layout in mind, use an HTTPS captive portal, lean on IPSK for BYOD and corporate guests, integrate with the tools you already use, and write down retention rules clearly. Trust the metrics only when three access points see the same device, because that is the point where location-style analytics starts to deserve confidence Wi-Fi analytics use cases.

If a building already has guest Wi-Fi, the work now is less about buying more gear and more about tightening the design, the consent flow, and the way the metrics are read. Start with the portal, validate the radio layout, keep the data model lean, and make sure the numbers shared with management point to real business actions. That is how guest Wi-Fi analytics stops sounding like marketing copy and starts behaving like something a hotel, school, or retail team can trust.