You're standing by the shop door with a clipboard on Saturday, tallying visitors between serving customers. By the following weekend, you can't tell whether trade is genuinely quieter or just feels that way. Sales tell you what customers bought, but not how many opportunities you had to make a sale.
Footfall counting helps fill that gap. The useful part isn't just getting a total, though. It's understanding exactly what you've counted, where the measurement can mislead, and which decisions the numbers can reasonably support.
What Footfall Counting Measures and Why It Matters
Say your Saturday tally covers the main entrance, but the following week a colleague counts everyone passing the window. Both totals might be accurate. They still aren't comparable because you've measured different things.
Footfall counting records people entering or passing a defined location during a specified period. A single headcount is a photograph. Repeated footfall measurements are more like a film, showing the rhythm of arrivals, busy spells and quiet hours.
The German Federal Statistical Office's pedestrian-counting paper describes the shift from labour-intensive manual tallies, often conducted seasonally or annually, to automated measurement that supports continuous time-series comparisons.
The sensing options include infrared beams, thermal imaging, video analytics, Wi-Fi or GPS signals, and lasers.

For a venue manager, repeated observations make practical questions easier to answer. Does the reception rush happen before lunch? Does a campus building become busy around class changes? Does a promotion attract people into the shop, or merely draw attention outside?
Start with the unit
Entries are crossings into a space, not necessarily different people. A customer who leaves to collect something and returns can generate another entry without becoming another unique visitor.
Likewise, occupancy means people present at a particular moment, not everyone who arrived during the day. Mixing those measures is like comparing a car park's current spaces used with its total daily arrivals.
Practical rule: A count only means something when the place, time window and unit, entries, visits, devices or people, stay consistent.
Keep that distinction beside the other useful measures: dwell time describes how long a visit lasts, return rate describes repeat activity, and conversion connects an appropriately defined visitor measure with sales. Each answers a different management question.
Choosing the Right Footfall Counting Method
| Method | How it counts | Best for | Main weakness |
|---|---|---|---|
| Active infrared beam | Records a passage when someone breaks the beam | Single doorways and long-term baseline counts | Clustered pedestrians can merge into one detection |
| Passive infrared | Detects changes in body temperature as people pass | Simple doorways on a low budget | People passing together can be missed |
| Video and computer vision | Analyses camera frames for people, direction and zones | Crowded or behaviour-rich spaces needing dwell-time and repeat-visit analysis | Needs careful camera placement and privacy governance |
| Wi-Fi presence | Counts devices that associate with access points | Device-based visit and return patterns across sites | Counts devices, not people; someone may carry several |
| Manual tally | Staff count people at a fixed point | Validating automated samples | Labour-intensive and usually occasional |
Read each row as a match between the question you need answered and the failure you can tolerate.
The Active Living Research counting guide reports roughly 5–15% undercounting for active infrared with clustered pedestrians, about 5–50% undercounting for passive infrared when people pass together, and 9–19% overall error in validation of a dual-sensor passive-infrared device. Those are findings from particular counting conditions, not promises about every installation.
Match the sensor to the space
A defensible architecture uses infrared for straightforward doors, camera analytics for dense or behaviour-rich spaces, and manual samples to check both. Don't buy a complicated journey-analysis system when you only need a dependable doorway baseline.
For camera projects, ABCO Security Services Australia video analytics provides additional context for discussing video-analysis applications with your installer. Keep that discussion focused on detection zones, camera views and the information your team needs.
For Cisco environments, Meraki security cameras provide a route to evaluating camera-based counting. Our Splash Access Advanced Location Analytics provides footfall overview and trends, return rates and dwell times across locations. We also integrate with the Cisco Meraki MV Sense location analytics API, enabling camera threshold alerts through Twilio, including manager alerts when more than 20 people have been seen in a zone within a time frame. Treat these as capabilities to test against your site conditions, not guaranteed measurement outcomes.
Make the trial useful
For steady doorway flow, start with infrared. For crowded zones, evaluate camera analytics with privacy settings; for a multi-site guest Wi-Fi estate, reconcile portal activity with entrance measurements.
As a practical trial, monitor an entrance and a busy internal zone over several weeks. Validate manual samples, retain raw readings and record corrected estimates separately.
Before installation, settle the reporting unit, the sensor for each zone and the minimum group size you'll publish.
How Accurate Footfall Counts Really Are
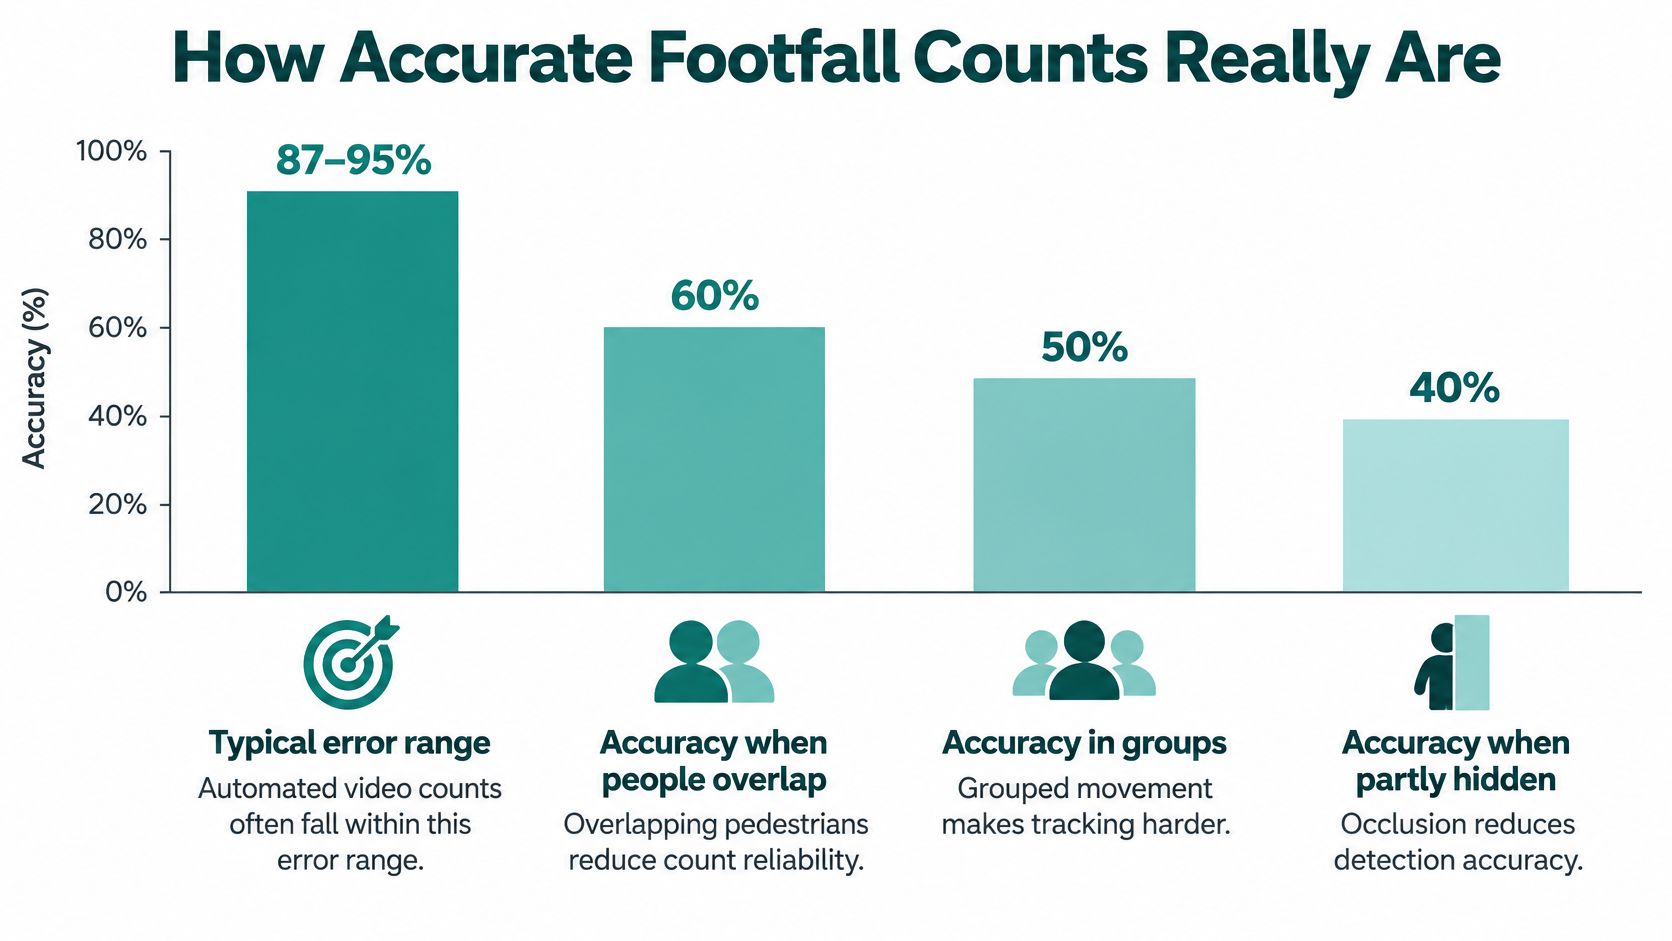
Automated video counts typically show errors of approximately 5–13% in pedestrian-counting studies, while overlapping people, groups and partial occlusion reduce accuracy, according to the Federal Highway Administration's monitoring guidance. The agency identifies group occlusion as an undercounting problem and notes that some systems can confuse pedestrians with bicyclists.
The daily total can therefore look reassuring while the busiest arrival period is poorly measured. That's particularly awkward when the arrival wave is exactly what you use to schedule reception staff or open another service desk.
Check the view before the algorithm
Use a high or top-down, unobstructed view where suitable for the system. Position the virtual counting line where visitors naturally separate, rather than where a queue compresses them into a group.
A hotel doorway may work better than the crowded check-in desk. At a campus gate, check whether students walk side by side and whether bicycles share the counting area.
Validate the moments that matter
Compare automated readings with synchronised manual or recorded-video samples. Include quiet periods, queue formation and surges rather than assuming a lunchtime spot check represents the entire day.
For each sampled hour, calculate a correction factor by dividing the observed ground-truth count by the automated count, provided the automated count isn't zero. Apply it only to comparable conditions, and recheck it when layouts or traffic patterns change.
Keep these reporting fields visible:
- Raw and adjusted counts: Preserve what the sensor recorded alongside your estimate.
- Uncertainty: Include an observed error range or a defensible confidence interval.
- Uptime and conditions: Record outages, sunlight, obstructions and unusual queueing.
Most importantly, detection accuracy isn't the same as measurement relevance. Even a doorway counter that records every crossing correctly can't establish unique visitors without an additional, appropriate way to distinguish repeat entries.
Linking Footfall Data to Guest Wi-Fi Analytics
A hotel reception desk checks a guest in before giving them access to their room. A captive portal performs a similar checkpoint function for guest Wi-Fi.
As explained in the Splash Access Wi-Fi connection guide, a newly connected device enters a restricted state, its first web request is redirected to a splash page, and broader internet access follows an approved action. That might mean accepting terms, entering an email address, using a voucher, choosing social login or paying.
Separate access approval from encryption
A portal is an access checkpoint, not an encryption method. Social login and social Wi-Fi can help register guests, but they don't, by themselves, encrypt wireless traffic.
In a Cisco Meraki design, keep an open guest SSID with portal authentication separate from WPA2-protected staff, student or corporate BYOD networks. Choose authentication solutions around the users and risks of each network, not around a desire to collect more analytics.
Click-through authentication prioritises a short onboarding process and doesn't establish a verified identity. Social login uses an identity-provider authorisation flow, commonly OAuth, to return approved information such as a name or email address. Request only attributes you need.
Give each dataset a job
Portal and Wi-Fi session records can contain device identifiers, association times and bandwidth information. Alongside entrance measurements, guest Wi-Fi analytics can help you investigate device-based dwell patterns and repeat activity.
But an association session isn't a stopwatch for a person's visit. Someone may arrive before connecting, disconnect while staying inside, or never join the network.
Staff for demand at the door using entrance counts and observed queues. Use reconciled device or unique-visitor estimates to investigate return behaviour, not as a substitute for everyone who needs service.
Before combining reports, align their time windows, locations and exclusion rules. Label device-based estimates clearly, and don't rename connected devices as visitors.
Protecting Privacy While Counting Visitors
The common assumption is that you must choose between anonymous sensors and useful analytics. In practice, privacy and usefulness involve a balance: protecting a small group can mean deliberately making its reported count less precise.
A privacy-preserving counting study evaluated methods that add more statistical noise to small-group counts, reporting relative error from 0 to 2.40 under one privacy setting and 0 to 11.40 under a stronger setting. These are relative-error values, not percentage accuracy ratings, and illustrate why stronger privacy protection can change measurement usefulness.
Protect people in context
A small gathering in a school corridor, care home or office can be identifiable without anyone seeing a face. A timestamp and location may be enough for someone familiar with the building to infer who was present.
Detecting human presence is different from biometric identification. That distinction doesn't remove the need to consider retention, repeated observations, access controls and consent expectations.
Use clear operating rules:
- Set a reporting minimum: Choose a minimum group size based on the setting and disclosure risk, rather than assuming a universal safe threshold.
- Suppress or combine small counts: Merge time windows or locations where a detailed display could expose individuals.
- Explain uncertainty: Mark protected estimates so managers don't interpret deliberate noise as a sudden operational change.
- Limit access and retention: Keep detailed records only as long as needed for a documented purpose.
Make the policy understandable
For a practical policy review, ELECTE's data protection guidance for small businesses can help frame questions about information handling. Translate those questions into plain visitor notices and named responsibilities for administrators.
At Splash Access, we'll only collect the information we need. Our data subject rights information is also relevant when planning how visitors can understand and exercise their rights.
The right target isn't maximum precision everywhere. It's enough reliable information to make a decision without exposing people unnecessarily.
Where Footfall Counting Pays Off by Sector
Use this comparison to connect each operational question with suitable counting points and a separate Wi-Fi access model. The sensor measures activity; the authentication setup controls network access.
| Sector | What to count | Wi-Fi access model | Counting points |
|---|---|---|---|
| Retail | Visitors entering, zone dwell time and return visits | Open guest SSID with captive portal, email or social login | Storefront entrance, key aisles, shopping-centre zones |
| Hospitality | Arrivals, lobby and restaurant occupancy, event-room use | Guest portal with voucher, social login or sponsor approval | Main entrance, lobby, restaurant and event rooms |
| Education | Campus gate entries, building traffic and class-change peaks | WPA2 with individual keys such as IPSK or EasyPSK for students | Campus gates, building entrances, corridors |
| Corporate BYOD | Office entries, meeting-room occupancy and visitor flow | WPA2 with individual keys per device for staff and BYOD | Office entrance, meeting rooms, co-working zones |
Turn the measurement into a decision
In retail, compare appropriately defined traffic with transactions to distinguish fewer opportunities from weaker conversion. If visits fall while conversion holds steady, the next action differs from a situation where plenty of people arrive but fewer buy.
Keep sales and visitor periods aligned, and exclude staff traffic where your system permits it. Practical ideas for increasing foot traffic in retail are easier to evaluate when you establish that baseline first.
For hospitality, arrivals help plan reception cover, while restaurant and event-room measurements answer separate service questions. In education, class-change peaks can guide corridor management without creating individual movement histories.
Keep authentication appropriate
Individual pre-shared keys such as IPSK or EasyPSK give each student or staff device its own key on a WPA2 network, allowing access to be revoked without changing a shared password. The Splash Access room Wi-Fi guide supports the general authentication principles, rather than documenting every Meraki-specific deployment, so confirm compatibility and configuration on your own network.
For corporate BYOD, coordinate key ownership and revocation with device onboarding and departures. Education, healthcare and senior living settings generally warrant the most conservative privacy settings because children, vulnerable people and sensitive activities may be involved.
How to Set Up a Footfall Measurement Plan
Write the plan before installing sensors. A short document with clear definitions is more useful than a dashboard whose totals nobody can explain.
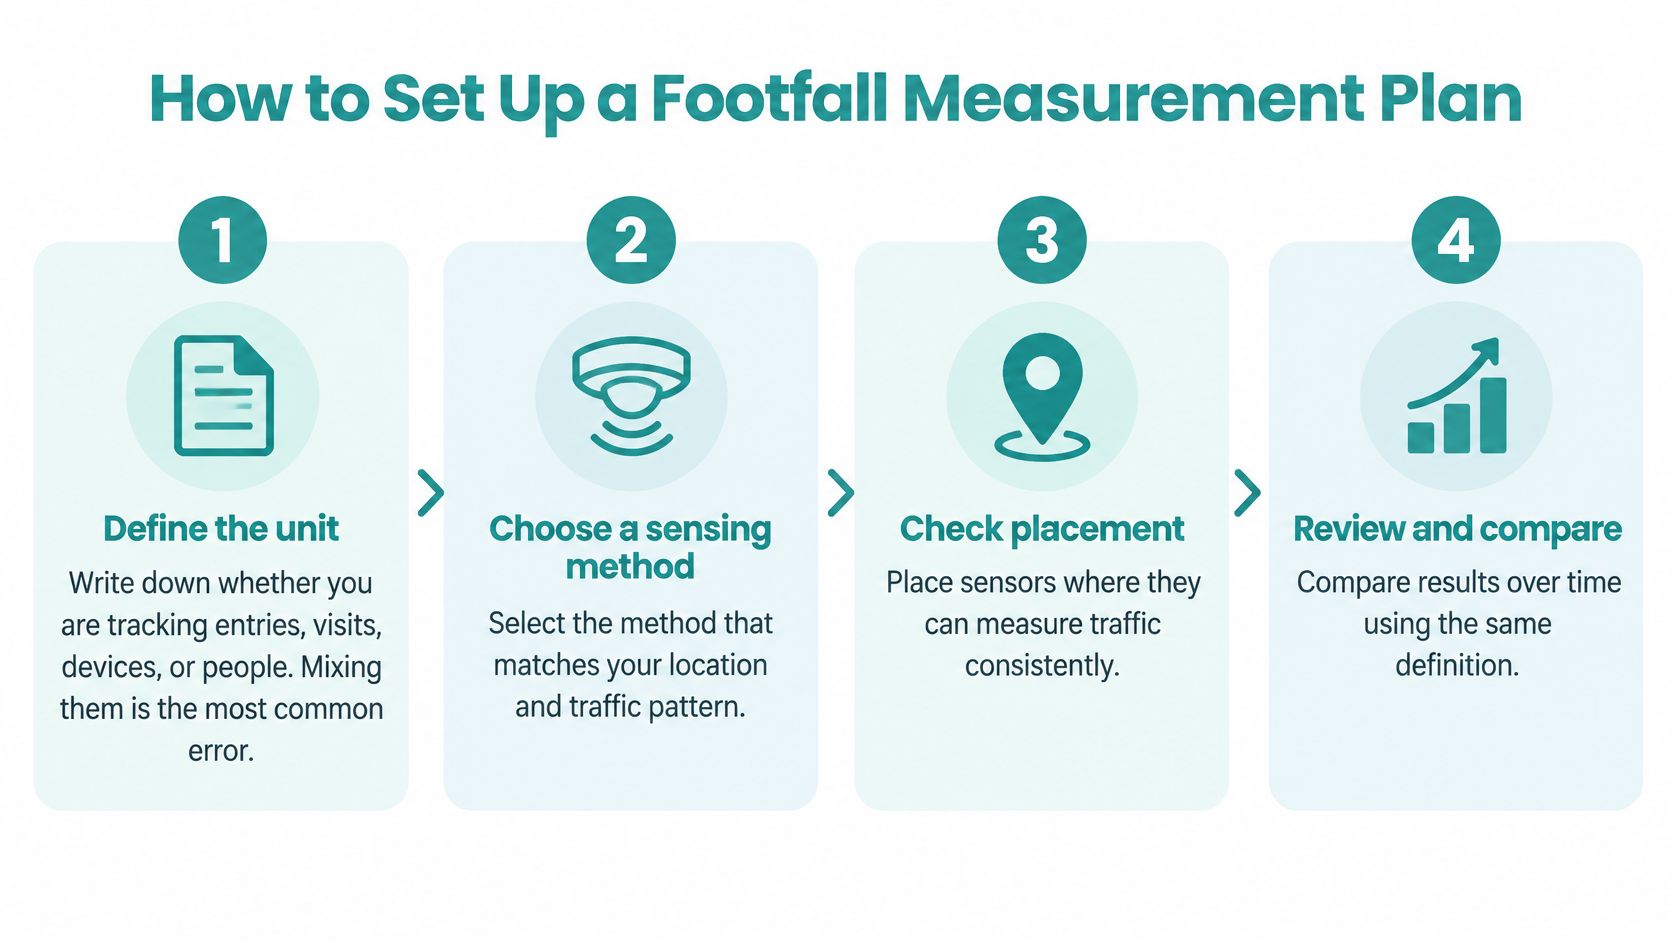
Build the routine
Define the unit. Write down whether you're reporting entries, visits, devices or people, together with the location and time window. A common slip is changing the label while leaving the underlying calculation unchanged.
Choose a sensor for each location based on the decision it must support. Don't assume the device that suits a narrow entrance will also suit a crowded lobby.
Check placement. For cameras, test a high or top-down view and a counting line where people separate. Avoid accepting a convenient mounting position without watching real traffic pass through it.
Validate against manual or recorded observations during both busy and quiet periods. Skipping off-peak samples can conceal false detections that matter when genuine traffic is low.
Calculate correction factors from synchronised samples. Keep adjusted estimates separate from raw counts and document where each factor applies. Don't carry an old adjustment into a changed layout without checking it.
Set a minimum publishable group size and configure suppression or aggregation. A common mistake is protecting the main dashboard while leaving detailed exports unrestricted.
Reconcile entrance and session records. Align clocks, reporting windows and location boundaries before estimating return activity. Never treat unmatched device totals as missing people.
Review monthly, including uptime, period-specific errors and operational changes. Record promotions, weather disruptions and events so you don't mistake every movement in the chart for a lasting demand change.
Check whether the plan supports action
For office projects, workspace analysis from Facility Management Insights provides context for connecting measurements with space-planning questions. Keep the intended decision explicit, such as reviewing meeting-room provision rather than monitoring named employees.
Connect your reporting to clearly defined engagement metrics, with an owner responsible for investigating unexpected changes. The plan is working when corrected counts match validation samples within your agreed tolerance and managers understand what the remaining uncertainty means.
Splash Access offers Cisco Meraki guest Wi-Fi, captive portals and location analytics to help connect visitor activity with network engagement. Visit Splash Access to discuss your entrances, busy zones and authentication needs, and build a measurement approach that keeps people counts, device activity and privacy clearly separated.