You can feel the gap the moment a lobby gets busy, a campus network heats up, or a retail floor fills with visitors. The team sees it later in reports, after the rush has already passed and the chance to act has gone. Real-time analytics closes that gap by turning live events into usable insight within milliseconds to seconds, so operators can respond while the moment still matters, not after it's over.
That's the simplest way to understand what is real time analytics. It's a streaming approach to data that ingests, processes, and makes information queryable almost immediately after something happens, so decisions can happen in the same flow as the event itself. In guest Wi-Fi, captive portals, authentication flows, and camera analytics, that difference changes the job from reviewing yesterday's activity to managing what's happening right now.
Setting the Scene for Real-Time Insights
It's 2 PM on a Saturday, and your hotel lobby feels full enough that staff should probably adjust the front desk flow, open another service lane, or watch the bar area more closely. But the report that confirms the surge won't land until much later, after the pace has already changed again. That's the everyday frustration real-time analytics is built to remove.

A practical definition helps: real-time analytics is the process of collecting, processing, and making data available almost immediately after an event occurs, often within milliseconds to seconds according to the market and engineering references in the brief. That speed is why the category has grown into enterprise infrastructure, with the global real-time data analytics market estimated at $38.5 billion in 2022 and described as growing at 29.7% CAGR, while another forecast projected $43.8 billion in 2026 and $223.3 billion by 2033 at 26.2% CAGR market overview. Those figures matter less as hype than as a sign that operators now expect live visibility, not stale summaries.
For venue teams, the point isn't a fancy dashboard. It's knowing whether guest Wi-Fi onboarding is failing, whether a social login campaign is moving people forward, or whether a busy entrance needs attention before the line becomes a complaint. If you want a concrete example of how live alerts get tied to operational action, the workflow around real-time alerting with webhooks shows how quickly a signal can become a response.
Practical rule: if the data can't change what your team does right now, it probably doesn't need real-time treatment.
The same idea applies whether you're managing a hotel, a stadium, a campus, or a retail center. Live data only becomes valuable when it reaches the people who can act on it while guests are still on-site.
Batch Processing Versus Streaming Analytics
Batch processing is like reading yesterday's newspaper to decide what to do this morning. It still has value, because it captures the bigger picture and supports long-view reporting, but it arrives after the most urgent decisions have already been made. Streaming analytics, by contrast, is the phone alert that arrives the second something important happens.
Traditional batch systems collect data in chunks, usually overnight or on a schedule, then process it and publish reports later. By the time a manager opens that report, the guest rush may be over, the staffing gap may have passed, and the captive portal issue may already have frustrated people. Real-time analytics works differently because it processes events as they arrive, which means clicks, authentication attempts, sensor readings, and user activity can be analyzed while they're still relevant.

Why latency changes the decision
The big shift isn't only technical, it's operational. When data moves from hours or days to milliseconds or seconds, the decision model changes from retrospective review to in-the-moment control. That's why live dashboards, fast alerts, and automatic responses have become standard expectations in environments where guest flow and access behavior change minute by minute.
Batch is still fine for finance closeouts, weekly summaries, or retrospective planning. Real-time is for the questions that need an answer now, like whether a guest login is failing in the lobby, whether a crowd is building near a concession stand, or whether an event-triggered offer should appear before the visitor leaves.
Driving with only a rearview mirror still gets you somewhere, but it's not the safest way to steer a busy venue.
For operators, the choice is rarely philosophical. It comes down to whether the business decision loses value if it waits until tomorrow. If it does, batch is the wrong tool.
You can also see the same contrast in network operations. A network performance monitoring tools workflow is useful when you need live visibility into what the network is doing, not just what it did last night. That's the difference between observation and intervention.
How the Real-Time Data Pipeline Works
A real-time pipeline has three simple moves, even if the underlying stack looks complicated at first glance. Ingest, process, and serve. Once you map those steps to guest Wi-Fi or camera events, the whole idea gets much easier to picture.
Ingest means the event is captured now
Ingestion begins the moment a guest connects to Wi-Fi, submits a social login, authenticates through a captive portal, or passes a camera sensor. IBM describes real-time analytics as continuous collection from sources such as IoT sensors, mobile apps, social media, transactional systems, and cloud services, followed by integration and automated responses IBM on real-time analytics. In a venue, that could mean a login attempt, a device change, a return visit signal, or a camera-based presence event.
Process means the system interprets the stream
Processing is where rules, joins, calculations, and detections happen while the data is still moving. Industry guidance in the brief distinguishes continuous systems, which proactively alert or trigger workflows as data arrives, from on-demand systems, which only compute results when someone asks a question. That matters because continuous pipelines fit live guest experiences better when you need to respond before the guest leaves the lobby or abandons the checkout flow.
Serve means the insight reaches someone or something useful
Serving is the handoff to dashboards, alerts, or automated actions. In practice, the best systems don't just display data, they push it into the workflow where a staff member, a rules engine, or an API-driven action can use it immediately. That's why real-time analytics is often paired with alerting and automation in production setups.
The practical benchmark for operational teams is freshness. If your data can't stay fresh enough for a live dashboard, anomaly detection, or a customer-facing action, then it's probably not real-time in the way venue operators need it to be. The distinction between continuous and on-demand also affects architecture, because a continuously updated system has to be built to support a record-by-record flow rather than a delayed query cycle.
For a broader technical view of the API side of this flow, API connectivity for analytics systems is a useful companion concept. It shows how the data doesn't just exist in a pipeline, it has to reach the tools that use it.
Tools and Integration Patterns That Make It Happen
The trick isn't finding a single magic tool. It's stitching together the pieces so the network, the portal, the cameras, and the analytics layer all speak the same operational language. That's where modern WiFi and guest access platforms fit naturally into real-time analytics.
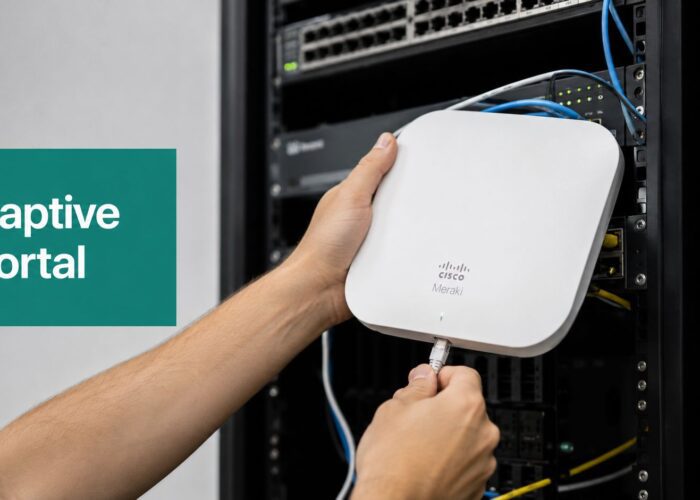
Cisco Meraki access points and cameras can produce live signals from guest movement, association events, and camera analytics. Splash Access can sit on top of that kind of environment to handle captive portals, social login, guest Wi-Fi analytics, and authentication flows, including IPSK and EasyPSK use cases. In a hotel, education campus, retail center, or BYOD corporate office, those events become useful only when they're connected to a workflow that can react.

What the integration pattern usually looks like
The pattern is straightforward even when the vendor list gets long. A guest connects. The portal records the event. The analytics layer enriches it. Then dashboards, alerts, or campaign tools use it immediately.
- Meraki camera signals: These can support live presence and movement analysis, which helps operators understand how visitors are flowing through a space.
- Captive portal events: Login attempts, authentication success, and session changes can feed real-time reporting and action.
- Social login and social WiFi: These can capture consented guest identity signals that support personalized follow-up or targeted offers.
- IPSK and EasyPSK: These authentication methods can help map access to individual guests or user groups without turning the network into a manual ticketing exercise.
For operators who want a practical example of live promotion routing, browse nearby promotions shows how location-aware context can be turned into immediate action. That kind of linkage is useful when the analytics system is meant to do more than just observe.
Why managed integration matters
Most venues don't need to build custom streaming infrastructure from scratch. They need a stack that can ingest events, apply logic, and expose results without dragging a data engineering team into every change request. That's the value of integration patterns, they reduce handoffs and make live guest data usable in day-to-day operations.
A workable approach can include dashboards, API feeds, and automation rules tied to real events instead of static reports. If the network already knows something useful, the analytics layer should surface it before the moment passes.
For teams looking at dashboard automation, automate it with a dashboard API shows how live metrics can become something operational rather than decorative. That's the right mindset for real-time systems in venues.
Measuring What Matters Latency KPIs and SLAs
A live dashboard can look impressive and still miss the operational moment. A venue team needs measurements that show whether the insight arrived while it could still affect the guest experience, the login flow, or the next staff response. Real-time analytics only matters when the latency KPIs line up with a real business decision.
The metrics that matter most
| Metric | Target | Why It Matters |
|---|---|---|
| Event latency | Sub-second to few-seconds freshness | Shows whether an event is still useful by the time it reaches the team |
| Dashboard freshness | Updated continuously or near-continuously | Keeps staff focused on current conditions instead of stale snapshots |
| Alert delivery time | Fast enough to reach action before the moment passes | Gives staff a chance to respond while guests are still present |
| Decision latency | Time from insight to human or automated response | Shows whether the business can actually act on the data |
| Workflow automation | Triggered when rules are met | Turns insight into action without waiting for manual review |
The industry guidance points to sub-second to few-seconds freshness for use cases that depend on live behavior. That target fits live dashboards, anomaly detection, captive portal flows, and customer-facing actions. The point is not to chase the fastest possible number. It is to match the speed of the metric to the speed of the decision.
A good SLA asks a practical question
A service-level agreement for real-time analytics should define what “fresh enough” means for each use case. If a login failure needs to reach staff before a guest gives up, the SLA should reflect that window. If a personalized offer only matters during the current session, the response time has to fit that session.
A venue operator can use the same mindset they already use for WiFi health. A captive portal that loads slowly, or an authentication flow that stalls, creates a visible problem only if the team sees it fast enough to respond. Real-time analytics works the same way, the metric has to arrive before the business moment closes.
Decision latency matters more than vanity speed. If the workflow is too slow or too manual, shaving a second off the dashboard will not change much.
Use latency checks to separate useful systems from decorative ones. If the pipeline is fast but nobody can respond in time, the value drops sharply. If the pipeline is fast and the action is automated, the value becomes obvious.
For a deeper look at the metrics behind these targets, see our guide to network performance metrics.
Privacy Security and Guest Trust
Real-time analytics gets stronger when guests trust the system enough to use it. That means the design can't stop at speed, it has to include privacy, security, and clear consent handling from the start.
Captive portals are one of the cleanest places to manage that consent because the guest is already interacting with the access flow. That makes it possible to explain what data is collected, why it's collected, and how it's used before the analytics layer starts doing anything with it. For access control, IPSK can support a more individualized approach than a shared password model, which helps operators keep guest identity and network access organized without making the user experience clumsy.
What responsible design usually includes
- Data minimization: Collect only the fields needed for the guest experience or operational decision.
- Consent management: Use the captive portal to make consent visible and understandable.
- Encryption: Protect data in transit and at rest.
- Access controls: Limit who can see live guest information and why.
- Clear retention rules: Keep data only as long as the use case requires.
That balance matters in guest Wi-Fi environments because personalized experiences can easily drift into surveillance if the boundaries aren't clear. Social login, social WiFi, and live analytics should support relevant offers, smoother onboarding, and better service, not surprise guests with opaque tracking. If visitors understand the tradeoff and can opt in knowingly, the system is easier to defend and easier to operate.
The best trust signal is transparency. When guests know what happens to their data and can see the benefit in return, the analytics layer stops feeling intrusive and starts feeling helpful. That's especially important in education, retail, and BYOD corporate settings, where users expect access to work smoothly but still expect their information to be handled carefully.
Industry Use Cases That Deliver Real ROI
Real-time analytics becomes obvious when you watch it solve different problems in different environments. Hotels, stores, campuses, and healthcare facilities all need live data for different reasons, but the pattern is the same, the system turns a current event into a current decision.
Hotels and resorts
A guest connects to Wi-Fi, identifies through a captive portal, and receives a welcome flow that reflects the current visit rather than a generic message. That's where real-time captive portal analytics helps staff understand return guests, session quality, and engagement while the stay is still unfolding. It's also where real-time QR menu updates become relevant in food and beverage settings, because live menu changes are only useful if they show up while the guest is still deciding what to order.
Retail spaces
Retail teams can combine camera analytics from Meraki MV sensors with guest Wi-Fi and dwell signals to understand where traffic concentrates and where it drops off. That supports staffing, merchandising, and offer timing without waiting for the end-of-day summary. If the floor is busy near one entrance and quiet near another, the response should happen while customers are still moving through the space.
Education campuses
On campuses, real-time analytics helps operators monitor dorm and guest network behavior, support onboarding, and adjust bandwidth or access policies during peak use. That matters in BYOD environments where many devices connect at once and the support desk needs faster visibility into what's happening. The goal isn't surveillance, it's smoother access and fewer avoidable bottlenecks.
Healthcare facilities
Healthcare settings use streaming data to keep an eye on access, patient flow, and operational pressure points. The value here is coordination, because live signals help teams respond to congestion before it becomes delay. In all of these settings, the ROI shows up as fewer waits, better allocation, and more timely guest or patient experiences.
Splash Access fits naturally in these environments because it connects guest Wi-Fi, captive portals, and authentication workflows to live operational insight. That makes it relevant for hotels, education, healthcare, retail, and corporate guest access without forcing each venue to assemble its own custom stack.
Your Roadmap to Real-Time Analytics
The easiest way to start is to identify one decision that loses value when it waits. That could be a captive portal issue, a guest Wi-Fi onboarding problem, a camera-based crowd signal, or a social login offer that needs to land during the visit, not after. From there, build around the decision, not around the technology for its own sake.
A practical path looks like this. First, map your live data sources. Second, choose the one use case with the clearest operational payoff. Third, connect the platform integrations that can move the event into action. Fourth, measure freshness, response time, and whether the team behaves differently because the data is live.
Start with guest Wi-Fi if the network already touches the customer journey. Expand into camera insights, authentication signals, and cross-channel personalization once the first workflow is stable. The barrier isn't whether the technology exists, it's whether your team knows which decisions need to happen faster.
If you want to turn guest Wi-Fi, captive portals, IPSK and EasyPSK authentication, and live venue signals into practical decisions, visit Splash Access and see how its Wi-Fi analytics and Meraki-focused workflows fit into a real-time operating model. It's a useful next step if you're ready to make live data part of how your venue runs every day.