Hey there, retail leaders! Ever feel like you're steering your ship with a blurry map? You see daily sales, but what about the hidden currents shaping your success? In today's hyper-competitive environment, whether you're in a sprawling mall, a busy campus store, or managing a corporate BYOD environment, gut feelings just don't cut it. To truly thrive, you need data. That's where understanding key retail store performance metrics comes in.
It's about transforming raw numbers into a clear story about your customers, your operations, and your growth potential. And believe it or not, your Wi-Fi network is one of the most powerful tools in your arsenal for capturing this data. By leveraging solutions built on robust platforms like Cisco Meraki, you can turn your guest Wi-Fi from a simple amenity into an intelligence-gathering powerhouse.
Think about the insights you could gain from a Captive Portal that not only authenticates users securely with solutions like EasyPSK or IPSK but also tracks footfall and dwell time. These insights are vital across various sectors, including Retail, Education, and corporate settings with BYOD policies. Of course, insights are only as good as the infrastructure supporting them. You must optimize internet speed for business success, as it impacts everything from POS transactions to customer engagement tools. Let's dive into the seven metrics that will give you that 20/20 vision and help you make smarter, more profitable decisions.
1. Sales Per Square Foot
Sales Per Square Foot (SPSF) is a classic but crucial retail store performance metric that measures how efficiently your store generates revenue from its physical space. It's all about figuring out how well every square foot of your sales area is working to move products and connect with customers. For retailers in competitive sectors, getting the most out of your floor space is key to maximizing profitability.
How to Calculate Sales Per Square Foot
Calculating this metric is pretty straightforward. You just divide your total net sales for a certain period (like a year or a quarter) by the total square footage of your selling space. It's super important to exclude non-selling areas like stockrooms, offices, and restrooms from your square footage calculation to get a true read on your floor's productivity.
Formula:Sales Per Square Foot = Total Net Sales / Total Selling Area (in Square Feet)
Why It's a Key Performance Indicator
SPSF is way more than just a number; it’s a powerful diagnostic tool. A high SPSF tells you your space is being used efficiently, your products are well-placed, and your store layout is a winner. On the flip side, a low or declining SPSF can be a red flag for issues like poor merchandising, underperforming product lines, or an inefficient store design. Tracking this metric helps you see which store layouts are rocking it and where you might need to make some tweaks.
This vertical bar chart compares the annual sales per square foot for a few well-known retailers, illustrating the vast differences in space productivity across different market segments.
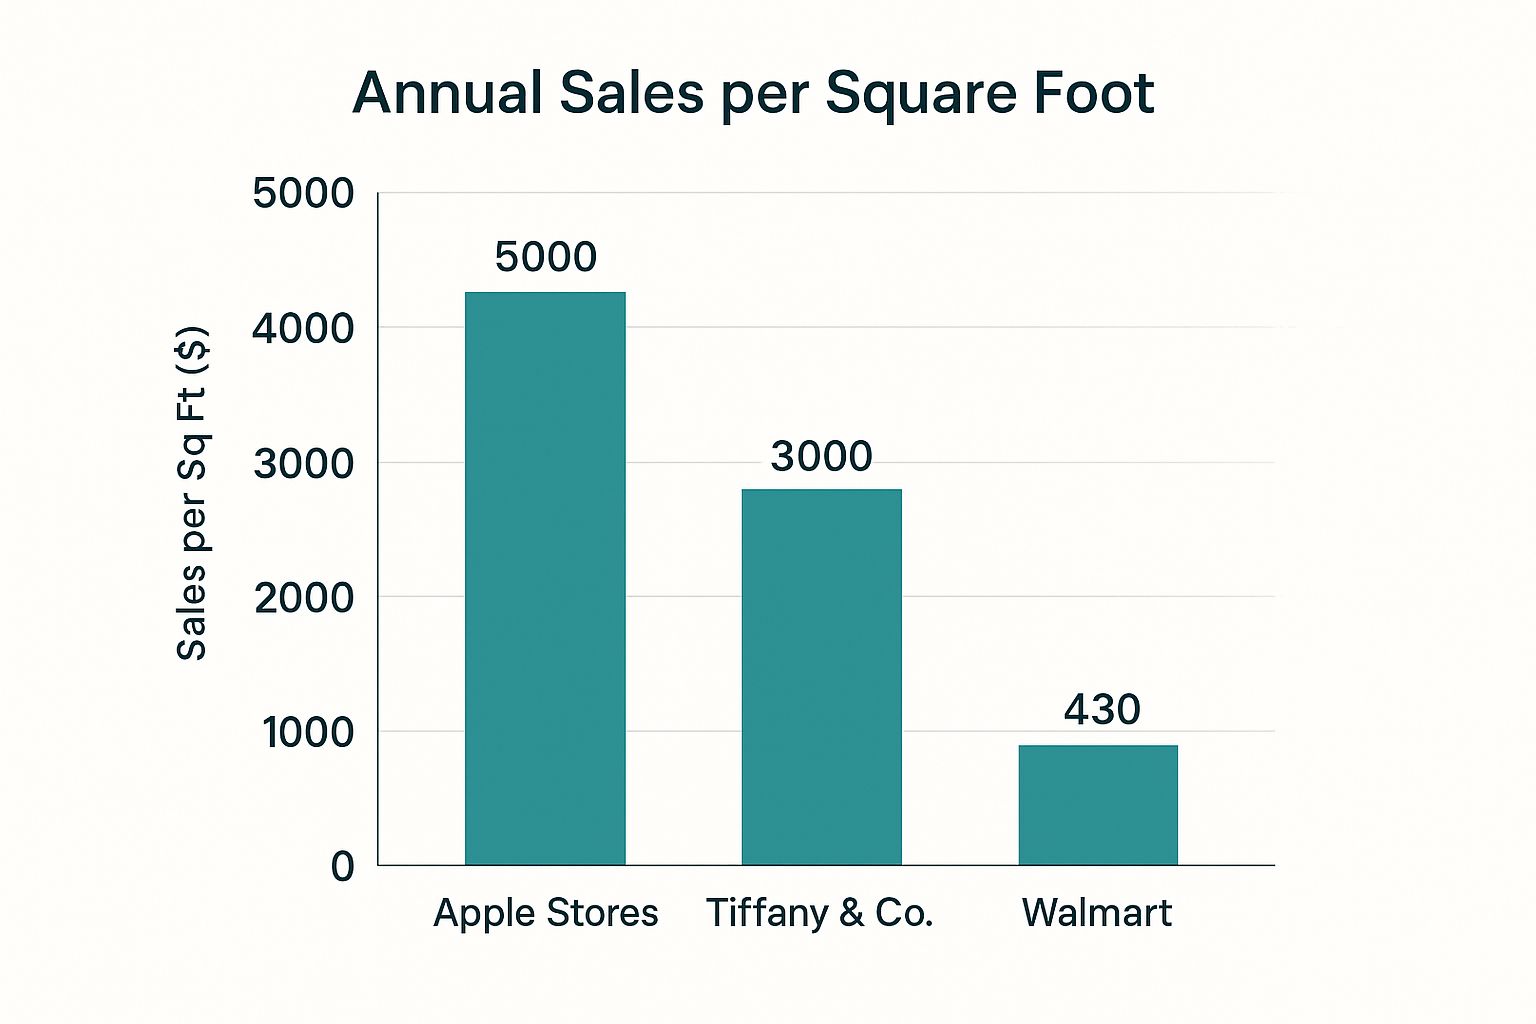
The chart highlights how high-value, small-footprint products, like those at Apple, can generate exceptionally high returns on space compared to high-volume, lower-margin retailers.
Actionable Tips for Improvement
- Analyze Layout and Flow: Use your SPSF data to experiment with different store layouts. Put your best-selling products in high-traffic areas and rethink those underperforming zones.
- Integrate Wi-Fi Analytics: Leverage guest Wi-Fi solutions, especially on a Cisco or Meraki network, to track customer movement and dwell times. By understanding shopper paths through a Captive Portal, you can connect foot traffic with sales data from specific zones, helping you spot layout bottlenecks or opportunities.
- Segment Your Analysis: Don't just look at the store-wide average. Calculate SPSF for different departments or product categories to pinpoint exactly which areas are bringing in the revenue and which are lagging behind.
- Benchmark Wisely: Compare your SPSF not only against the big players but also against your direct competitors and your own past performance. This gives you a realistic target for setting improvement goals.
2. Conversion Rate
Conversion Rate is one of the most vital retail store performance metrics, showing the percentage of store visitors who actually buy something. It's a direct measure of how well your store environment, product displays, and sales team are turning casual browsers into happy customers. A high conversion rate means your in-store strategy is firing on all cylinders, while a low rate points to a snag somewhere in the customer journey.
This metric is super important for Retail and corporate settings with on-site stores, as well as Education campuses, because it shows how effective your staff engagement and merchandising are, beyond just the raw number of people walking through the door.
How to Calculate Conversion Rate
The calculation is simple: divide the total number of sales transactions by the total number of visitors during the same period, then multiply by 100 to get a percentage. Getting an accurate visitor count is key here, which you can do with door sensors or even better, with advanced Wi-Fi analytics.
Formula:Conversion Rate = (Number of Sales Transactions / Total Number of Visitors) x 100
Why It's a Key Performance Indicator
Your Conversion Rate gives a clear verdict on your store’s performance. While foot traffic shows you’re good at attracting people, the conversion rate shows you're great at selling to them. It helps you pinpoint problems with pricing, staff training, product availability, or your checkout process. For instance, a store with tons of traffic but a low conversion rate might have an engagement problem that needs fixing.
Tracking this metric is crucial for optimizing everything from staff scheduling to the layout of your sales floor. It helps you understand the impact of your sales associates and the overall in-store experience.
Actionable Tips for Improvement
- Invest in People-Counting Technology: Use accurate visitor tracking, like Wi-Fi analytics from solutions compatible with Cisco Meraki, to get a precise count of shoppers. Captive Portals can provide data on visitor numbers and dwell times, which you can then compare against transaction data.
- Boost Staff Engagement: Train your team on how to have great conversations with customers. Well-trained associates who can answer questions and offer help are proven to lift conversion rates. Dive deeper into customer engagement best practices to help your team shine.
- Analyze by Time and Day: Break down your conversion rate by the hour, day, and week. This helps you line up your staffing schedules with peak conversion opportunities, making sure your best people are on the floor when it counts the most.
- Optimize the Checkout Process: A long or complicated checkout is a major reason people abandon their purchases. Streamline this process with mobile POS systems and make sure your authentication solutions, like EasyPSK for BYOD devices, don’t get in the way of a smooth payment experience.
3. Average Transaction Value (ATV)
Average Transaction Value (ATV) is a fantastic retail store performance metric that tells you the average amount a customer spends in a single transaction. It gives you awesome insight into customer buying habits and how well your sales strategies are working, from product bundles to staff training. For any retail business, from a high-street shop to a large shopping center, increasing ATV is a direct path to boosting your revenue without needing more people to walk in the door.
How to Calculate Average Transaction Value
Calculating this metric is easy and super effective. You just divide the total revenue you made over a specific period (like a day or week) by the total number of transactions that happened during that same time. This gives you a clear picture of the typical spend per customer visit.
Formula:Average Transaction Value = Total Revenue / Number of Transactions
Why It's a Key Performance Indicator
ATV is a vital sign of your sales process's health. A high ATV suggests that your upselling and cross-selling game is strong, your product mix is on point, and your customers see the value in making larger purchases. On the other hand, a flat or low ATV might mean you're missing opportunities, your team could use some more training, or your pricing strategies aren't encouraging those extra buys. Tracking ATV helps you fine-tune your sales approach and merchandising to get the most value out of every single customer interaction.
This metric is powerful because it shifts your focus from just getting more customers to getting more value from the customers you already have. For example, a store with a higher ATV can totally outperform a competitor that has more foot traffic but a lower average spend.
Actionable Tips for Improvement
- Train Staff on Upselling: Give your team the knowledge to suggest relevant, higher-value products or complementary items. This works wonders in places where customers are looking for advice, like electronics or specialty goods stores.
- Create Product Bundles: Group related items together at a slightly discounted price. A classic example is a "back to school" bundle in a campus store or a "starter kit" in a tech shop. This nudges customers to buy more than they originally planned.
- Leverage Wi-Fi Analytics: A solid guest Wi-Fi system, like one built on Cisco Meraki infrastructure, can do so much more than just provide internet. By analyzing data from the Captive Portal, you can spot high-value customer segments and send tailored promotions directly to them when they log in, encouraging bigger purchases during their visit.
- Optimize Store Layout: Place impulse-buy items and high-margin accessories near checkout counters or in high-traffic areas. Use insights from Wi-Fi heatmaps to see how customers move around and strategically position these products along the most common paths.
4. Inventory Turnover Rate
Inventory Turnover Rate is one of the most critical retail store performance metrics, showing you how many times you sell and replace your entire stock over a set period. It's a direct reflection of how efficiently you're managing your inventory and turning your product investment into sales. A healthy turnover rate means your products are flying off the shelves, not collecting dust and tying up your cash.
How to Calculate Inventory Turnover Rate
To calculate this metric, you divide the Cost of Goods Sold (COGS) by your average inventory value for the same period. Using COGS instead of revenue gives you a more accurate picture because it reflects the actual cost of the inventory. To get your average inventory, you usually add your beginning and ending inventory values and divide by two.
Formula:Inventory Turnover Rate = Cost of Goods Sold / Average Inventory
Why It's a Key Performance Indicator
This KPI is essential for checking your operational and financial health. A high turnover rate usually means you have strong sales and great inventory management. On the flip side, a low rate can be a sign of overstocking, sluggish sales, or products that are no longer in demand. For example, a grocery store might have a turnover of 15-20 times a year, while a luxury jewelry store might only turn over its stock once or twice. Both can be healthy if they fit the industry standard. Tracking this helps you avoid running out of popular items and cut losses on slow-movers.
Actionable Tips for Improvement
- Set Category-Specific Targets: Not all products move at the same speed. Check out industry benchmarks and set different turnover goals for various categories, from fast-moving items to seasonal goods.
- Leverage ABC Analysis: Prioritize your inventory management efforts. Focus on optimizing the turnover of your 'A' items (high-value, slow-moving) while setting up more automated, just-in-time ordering for your 'C' items (low-value, fast-moving).
- Run Strategic Promotions: Use targeted discounts, bundles, or marketing campaigns to clear out older or slow-moving stock. This frees up cash and space for products that will make you more money. A crucial aspect of store performance is how efficiently inventory is managed. To optimize stock levels and improve your turnover, explore these Best Practices for Inventory Management.
- Enhance Supply Chain Visibility: Use modern inventory management systems that link up with your sales data. Having a reliable network, like one powered by Cisco, ensures the data from your POS systems and inventory scanners is always accurate and available, giving you the real-time insights you need to make smart buying decisions.
5. Gross Margin Percentage
Gross Margin Percentage is a super important retail store performance metric that shows you the direct profitability of your merchandise. It measures how much profit you're making on the products you sell, before you factor in overhead costs like rent, utilities, and salaries. This metric is the foundation of a solid pricing strategy and a healthy product mix.
How to Calculate Gross Margin Percentage
Calculating this metric is all about subtracting the Cost of Goods Sold (COGS) from your total sales revenue. The result, which is your gross profit, is then divided by your total sales revenue and multiplied by 100 to get a percentage. This number tells you what portion of each dollar in sales is left over after you've paid for the product itself.
Formula:Gross Margin Percentage = ((Total Sales - COGS) / Total Sales) * 100
Why It's a Key Performance Indicator
Gross Margin Percentage is fundamental for understanding the financial health of your retail business. A healthy margin means your pricing and buying strategies are working well, while a low or shrinking margin can signal problems like pricing pressure from competitors, rising supplier costs, or a product mix that just isn't profitable. For example, grocery stores work on thin margins (around 20-25%) and rely on selling a lot of items, whereas jewelry stores can command much higher margins (50-60%) with lower sales volume.
Tracking this metric helps you figure out which products are your real profit drivers. This data is essential for making smart decisions about your inventory, promotions, and overall business strategy.
Actionable Tips for Improvement
- Monitor Margins by Category: Don’t just look at the overall store margin. Dive deeper and analyze the gross margin for individual product categories or even specific items to find your most and least profitable products.
- Negotiate Better Supplier Terms: If certain product categories consistently have low margins, use your sales data as leverage to negotiate better costs or payment terms with your suppliers.
- Implement Dynamic Pricing: Try out pricing strategies that can adapt to demand, seasonality, and what your competitors are doing. This lets you maximize margins on popular items while strategically discounting stock that's moving a bit slower.
- Optimize Product Placement: Put your high-margin products in prime, high-traffic spots within your store to make them more visible and boost their sales, which directly increases your overall profitability.
6. Customer Lifetime Value (CLV)
Customer Lifetime Value (CLV) is one of the most powerful retail store performance metrics, representing the total amount of money a business can expect from a single customer over their entire relationship with the brand. It shifts your focus from one-off sales to the long-term health of your customer relationships, helping you decide how much to invest in getting new customers and keeping the ones you have.
How to Calculate Customer Lifetime Value
While there are some really complex ways to figure this out, a simple way to calculate CLV is by multiplying the average purchase value by the average purchase frequency and the average customer lifespan. This gives you a powerful forecast of a customer's total worth, helping you make smart decisions on your marketing budget and customer service investments.
Formula (Simplified):CLV = (Average Purchase Value x Average Purchase Frequency) x Average Customer Lifespan
Why It's a Key Performance Indicator
CLV is a forward-looking metric that gives you deep insights into how sustainable your business is. A high CLV is a sign of strong customer loyalty, great retention strategies, and a healthy brand relationship. For example, a loyal coffee shop customer who comes in daily adds up to a huge CLV over the years. On the other hand, a low CLV can point to a "leaky bucket" problem, where you're constantly spending money to get new customers who don't stick around.
Tracking CLV helps you identify and take care of your most valuable customers. When you know who your best customers are, you can tailor marketing efforts and give them an amazing experience, turning them into long-term fans. For retail environments using advanced networking solutions like Cisco Meraki, this data becomes even more powerful when you combine it with insights from Captive Portal authentications.
Actionable Tips for Improvement
- Segment by CLV: Group your customers into high, medium, and low-value tiers. Use this to personalize your marketing campaigns, offering exclusive perks to your high-CLV customers and re-engagement deals to those who might be drifting away.
- Boost Retention Efforts: Use your Wi-Fi Captive Portal to automatically enroll customers in a loyalty program when they log in. This seamless experience encourages repeat visits and gives you a direct way to send personalized messages, a key strategy for improving Customer Lifetime Value on splashaccess.com.
- Set Acquisition Cost Limits: Use your CLV as a benchmark to figure out your maximum Customer Acquisition Cost (CAC). A healthy business model makes sure that the cost to get a customer is way less than their lifetime value.
- Analyze Purchase Frequency: Use your in-store analytics to understand what makes customers come back. Find popular product combinations or promotions that encourage people to visit more often, which in turn increases their overall value.
7. Foot Traffic and Traffic Patterns
Foot Traffic and Traffic Patterns are awesome retail store performance metrics that measure how many shoppers come into your store and how they move around the space. It’s about more than just counting heads at the door; it's about understanding the customer journey inside. Modern retailers are using cool technologies like Wi-Fi analytics, often powered by robust Cisco or Meraki hardware, to get this essential data.
Understanding traffic patterns helps you optimize everything from your store layout and product placement to staffing levels and marketing promos. For instance, an IKEA store is famous for designing its path to guide customers through every department, while Apple analyzes its in-store traffic to put its latest gadgets in the most engaging spots.
How to Calculate Foot Traffic and Traffic Patterns
While a simple door counter can give you a basic traffic number, the real insight comes from analyzing how people move. This is where Wi-Fi analytics is a total game-changer. By using a Captive Portal for guest Wi-Fi access, retailers can track anonymous device signals to create heat maps and path analyses. It’s not about a single formula but a collection of data points:
- Total Visitors: The total number of people entering the store.
- Dwell Time: The average time a shopper spends in the store or in a specific area.
- Path Analysis: The most common routes customers take through the store.
- Zone Traffic: The number of visitors who enter specific departments or aisles.
Why It's a Key Performance Indicator
Foot traffic is the lifeblood of a brick-and-mortar store; without it, you can't make sales. But analyzing the patterns is what really unlocks its strategic value. High traffic in one area but low sales could point to a pricing or merchandising issue. Low traffic to a high-margin section might mean there's a layout or visibility problem that needs your attention.
This metric is vital for figuring out the health of your physical store environment. It gives you the "why" behind your sales numbers, showing how shopper behavior directly impacts your revenue. Tracking these patterns lets you make decisions based on data, not just guesswork. For those interested in leveraging their existing infrastructure, location-based marketing solutions can turn a standard Wi-Fi network into a powerful analytics tool.
Actionable Tips for Improvement
- Correlate with Sales Data: Combine your foot traffic data with your conversion rates. This creates a powerful metric, "sales per visitor," which tells you how effectively you're turning browsers into buyers.
- Use Heat Mapping: Leverage your Wi-Fi infrastructure from providers like Cisco to generate heat maps. These visual guides show you the "hot" and "cold" zones in your store, helping you find underused areas and optimize your product placement.
- Adjust Staffing Dynamically: Look at your traffic trends by time of day and day of the week. Schedule more staff during peak hours and in busy areas to improve customer service and avoid missed sales.
- Optimize Product Placement: Put high-impulse or high-margin items along the most popular customer paths. Use what you learn from traffic patterns to test and fine-tune your merchandising strategy for the biggest impact.
Retail Store Performance Metrics Comparison
| Metric | Implementation Complexity 🔄 | Resource Requirements ⚡ | Expected Outcomes 📊 | Ideal Use Cases 💡 | Key Advantages ⭐ |
|---|---|---|---|---|---|
| Sales Per Square Foot | Low – simple calculation | Low – sales and space data | Measures space efficiency and sales density | Retail space optimization, lease negotiations | Standard industry benchmark, easy to compare |
| Conversion Rate | Medium – requires visitor counting | Medium – requires counting tech | Measures sales effectiveness per visitor | Improving sales tactics, staff training | Real-time tracking, applicable online & offline |
| Average Transaction Value | Low – straightforward calculation | Low – sales and transaction data | Indicates customer spending per purchase | Pricing strategy, upselling and promotions | Guides sales targets and promotion effectiveness |
| Inventory Turnover Rate | Medium – needs COGS and inventory | Medium – accounting and tracking | Shows inventory management efficiency | Inventory control, cash flow optimization | Identifies slow-moving stock, reduces holding costs |
| Gross Margin Percentage | Medium – requires cost accounting | Medium – detailed sales & COGS | Measures product profitability and pricing | Pricing strategy, profitability analysis | Direct insight into profit margins |
| Customer Lifetime Value | High – complex predictive modeling | High – extensive customer data | Projects long-term customer value | Customer acquisition, retention, and segmentation | Justifies marketing spend, prioritizes customers |
| Foot Traffic & Patterns | High – sensor setup and analytics | High – hardware and software tech | Optimizes store layout and staffing | Store operations, marketing effectiveness | Provides actionable insights on customer flow |
Turn Your Metrics into Momentum
So there you have it—a friendly guide to the seven retail store performance metrics that can completely change how you understand and run your business. From the physical efficiency measured by Sales Per Square Foot to the customer loyalty captured by Customer Lifetime Value (CLV), each metric gives you a unique way to look at your success. We've talked about how tracking your Conversion Rate shows how effective your sales team is, while Average Transaction Value (ATV) points out awesome upselling opportunities.
But remember, collecting this data is only half the fun. The real magic happens when you connect the dots between these numbers and use the insights to make smart, strategic moves. This is where a secure and data-rich Wi-Fi solution becomes your best friend, turning a simple amenity into a powerful analytics engine.
From Data Points to Action Plans
The true value of mastering these retail store performance metrics isn't just in knowing your numbers, but in using them to build momentum. Think of it this way:
- Foot Traffic and Conversion Rate: Knowing how many people walk in versus how many buy is huge. By using a Captive Portal on your guest Wi-Fi, you can see how promotional engagement connects to actual sales, letting you A/B test digital offers to see what really drives conversions.
- Customer Lifetime Value (CLV): How do you turn a one-time shopper into a lifelong fan? Use your network's authentication data to spot repeat visitors. A solution that works with your Cisco Meraki dashboard can help you create targeted marketing campaigns that recognize and reward loyalty, directly boosting CLV.
- Dwell Time and Sales Per Square Foot: Understanding where customers spend their time can help you nail your store layout and product placement. Advanced Wi-Fi analytics can provide heat maps, showing you the popular zones and quiet spots in your store, so you can optimize your floor plan for maximum revenue.
Unlocking Potential with Secure, Smart Wi-Fi
This data-driven approach isn't just for traditional Retail. For Education institutions managing BYOD environments or corporate offices welcoming guests, secure and smart network access is a must. Deploying robust authentication solutions like IPSK (Identity Pre-Shared Key) or EasyPSK ensures that every connection is secure, whether it's a student on campus or a visitor in a corporate building.
By integrating a platform like Splash Access with your Cisco Meraki network, you're not just offering free Wi-Fi; you're creating a dynamic tool for engagement and analytics. You can seamlessly deploy unique security credentials for different user groups while gathering the anonymized data needed to track these key performance metrics. This transforms your guest Wi-Fi from a simple cost into a strategic asset that fuels growth. It’s time to harness the power of your network and start making the data-driven decisions that will propel your business forward.
Ready to transform your network data into actionable retail insights? Discover how Splash Access integrates seamlessly with your Cisco Meraki setup to enhance security, capture valuable analytics, and help you master your retail store performance metrics. Visit Splash Access to see how you can turn your Wi-Fi into your most powerful business tool.


