You're standing by the tills at closing time, looking at a decent sales day, but you still can't answer two simple questions. Which entrance display pulled people in, and did the shoppers who browsed for ages ever come back? That's the gap good retail analytics software should close, and it's also where plenty of dashboards disappoint. This guide helps you judge platforms by whether the visitor data can be verified, linked to sales, and owned by your venue.
What Retail Analytics Software Covers Today
Say a store manager moves a promotion from the window to a mid store table. Sales rise that weekend, but was it the new layout, better weather, payday, or just heavier footfall from an event next door? Without visitor data alongside till data, she's guessing.
Retail analytics software is the reporting and analysis layer that turns sales, traffic, and visitor signals into decisions about staffing, layout, promotions, and stock. It combines point of sale transactions with what's happening on the floor, such as Wi-Fi presence, camera counts, or door sensors.

What Each Platform Can Actually See
Platforms differ a lot in what they can see. Some only know what was bought, at what price, and in which basket. Others know who walked in, how long they stayed in a zone, which route they took, and whether they returned within a set window.
Adoption isn't the question anymore. The Salesforce and Coresight Research omnichannel study from August 2019 found almost 80% of European retailers had adopted advanced data-analytics capabilities, with approximately 45% reporting analytics was fully implemented and another 34% having begun implementation in selected parts of the business. Maturity is the harder part, getting trusted numbers into daily decisions.
Buying a dashboard is easy. Getting a number your store, marketing, and finance teams all believe is the real work.
This guide is for single store retailers, shopping centers, exhibition and concert venues running guest Wi-Fi, and BYOD heavy corporate or education sites already running Cisco and Cisco Meraki networks. You'll leave with a capability table, a metrics verification list, latency benchmarks, an authentication guide, a pricing read, and a shortlist method you can use in a trial.
Capabilities to Compare Side by Side
Start with platform families, not feature counts. A long feature list tells you very little if the underlying signal can't answer your question.
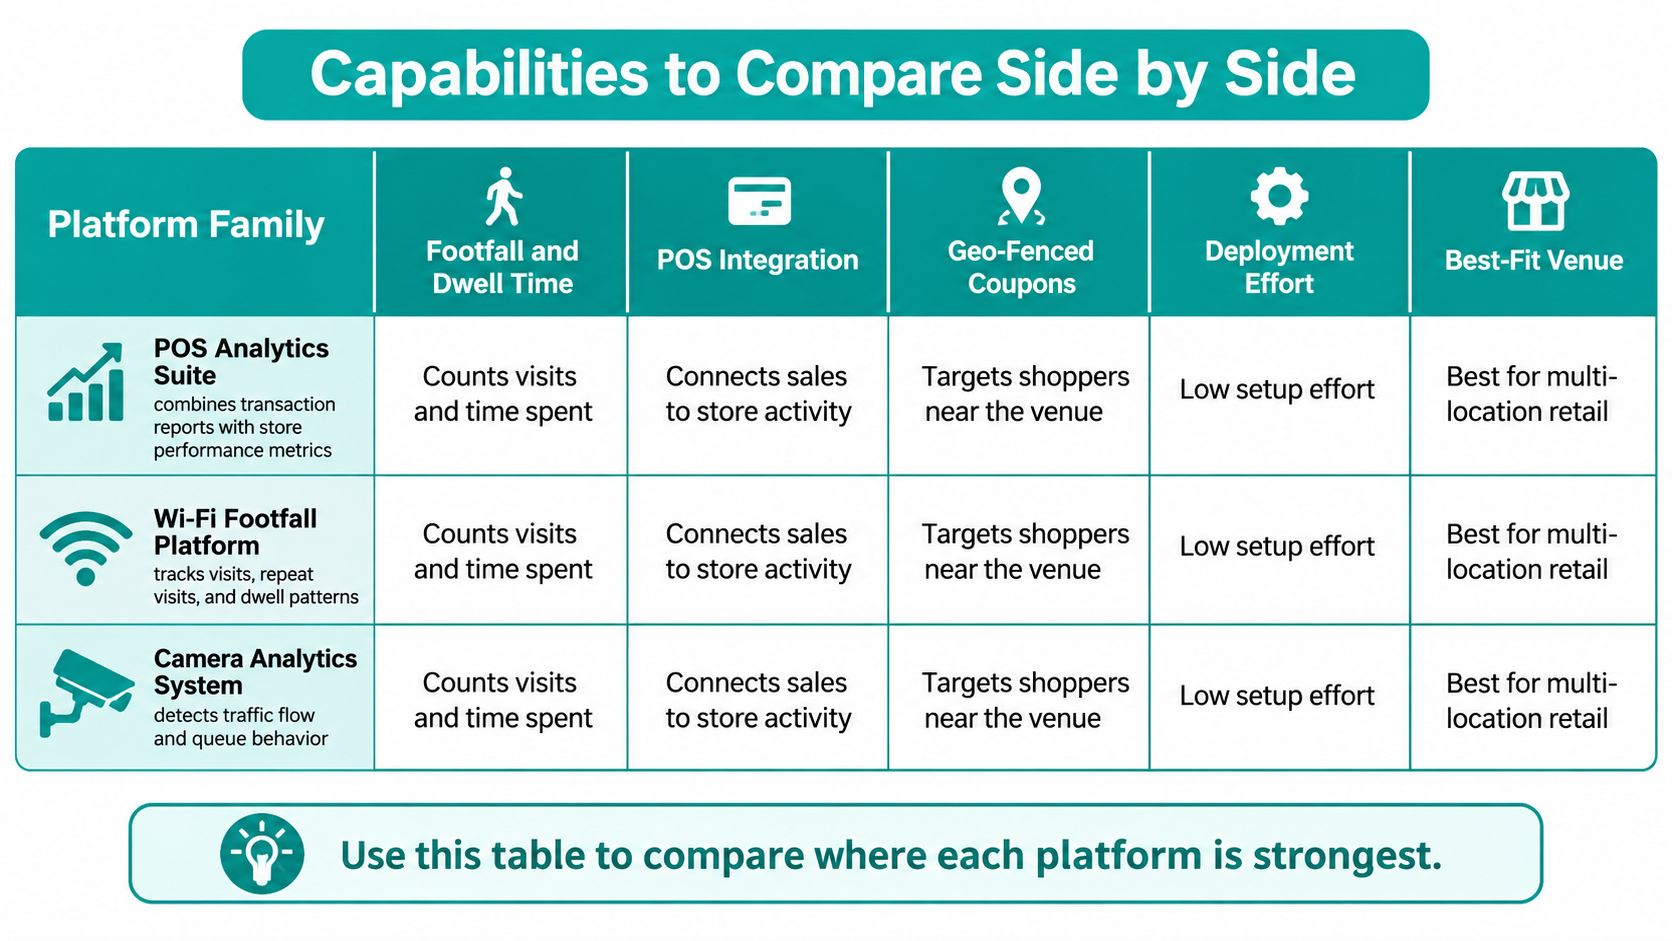
| Capability | POS-led analytics suites | Wi-Fi-based footfall platforms | Camera-based analytics |
|---|---|---|---|
| Footfall and dwell time | Estimated from door counts or basket data, rarely per zone | Device presence per zone, dwell time and return visits | Person counts and zone dwell measured from video |
| POS integration | Native and strongest, transaction-level | Usually through an API or scheduled export | Rarely direct, joined through a BI layer |
| Geo-fenced coupons | Usually not offered | Triggered by captive-portal location rules | Not a typical feature |
| Deployment effort | Low on the store side, data mapping is the real work | Access points in place or added, portal configured | Camera placement, lighting and calibration |
| Best fit | Chains with heavy merchandising and sales questions | Venues that need visitor data and guest Wi-Fi | Stores that need zone-level flow and queue data |
How to Read the Differences
POS led suites are strongest on sales, margin, and merchandising questions, but they only infer visitors indirectly. If nobody buys, the visit often disappears from the record. That's fine for range planning, less fine for judging a window display.
Wi-Fi based platforms see device presence by zone, dwell, and return visits, and they sit naturally alongside guest Wi-Fi. Camera based analytics add zone level flow, queue length, and more precise movement, but they need careful placement, decent lighting, and calibration. Splash Access offers Wi-Fi Analytics and MV Camera Analytics as separate modules, so you can test each signal before committing to both.
If you're also weighing the reporting layer for head office, it's worth comparing business dashboard features and pricing alongside the in store signals, because a pretty dashboard can't fix a weak data source. Our own guidance on retail store performance metrics that connect traffic to trading results is a useful companion when you're deciding which measures belong on that dashboard.
Geo-fenced coupons deserve a closer look because they're often sold as magic. In practice, a visitor's device enters a mapped zone, a captive portal location rule fires, and the offer is sent only after the visitor opts in. Ask four things before you get excited:
- Trigger radius: How tight is the zone, and can you set it by area rather than by whole store?
- Frequency caps: How often can one visitor be prompted before it becomes annoying?
- Till redemption: Is the coupon scanned or coded at the till in a way staff will use?
- Transaction link: Is redemption joined to the transaction so you can credit the offer fairly?
Most venues end up combining a Wi-Fi layer for visitors with a POS layer for money. Cameras become the add on when zone precision really matters.
Treat the table as a map, not a verdict. Your best fit depends on whether your biggest unknown is visitors, baskets, queues, or repeat visits.
Footfall and Dwell-Time Metrics to Verify
Vendor claims sound precise. Your job is to find out what's underneath them.
We list foot fall overview and trends, return rates and dwell times for visitors across all locations, plus insights into visitor behaviours within all of a customer's locations. Our MV camera analytics can detect gender, emotions, age, PPE (with or without face mask), helmets and gloves, with results monitored via our dashboard. That last capability raises a fair privacy question for any vendor, so ask how demographic outputs are aggregated, how long they're stored, and whether you can switch them off.
A solid evaluation shouldn't just count dashboards. The Basedash comparison framework for retail analytics tools recommends scoring platforms against a common data model, including conversion rate defined as transactions divided by visitors, and asking vendors to document sensor coverage, deduplication logic, timestamp synchronization, zone definitions, and conversion denominator methodology.
| Metric | Definition | Verify with the vendor |
|---|---|---|
| Visitor count | Unique devices or people entering a zone or site | Deduplication logic and sensor coverage |
| Dwell time | Minutes spent in a zone during one visit | Timestamp synchronisation and zone boundaries |
| Return rate | Share of visitors seen again within a set window, such as 30 days | Identifier persistence and the length of the window |
| Conversion rate | Transactions divided by visitors | Which visitor count forms the denominator |
| Heat map and shopper path | Aggregated movement across zones over time | Aggregation level and privacy controls |
Two Quick Sanity Checks
Say a 40 square metre zone is covered by two access points. A phone roams between them while its owner browses one rail. Without deduplication, that one shopper can count twice, and your dwell figures split into two shorter visits.
Conversion is even more sensitive. Say you record 1,000 visitors and 120 transactions, giving 12% conversion. If another sensor counts 1,500 visitors for the same period, the same sales suddenly show 8% conversion. Nothing changed in store, only the denominator did. That's why cross channel footprint thinking matters in other sectors too, much like teams who compare wine footprints across channels need consistent definitions before the comparison means anything.
Before you trust a trial, read up on how footfall counting works in practice and then put four questions to every vendor:
- Deduplication: How do you stop one device or person being counted twice?
- Timestamps: How are clocks synchronised across access points, cameras, and tills?
- Zones: Who draws zone boundaries, and can we change them without a support ticket?
- Denominator: Which exact visitor count defines conversion?
For return on investment, don't lean on raw visitor totals. Record a control period before a campaign, keep a comparable store or zone as a holdout, and measure incremental transactions against that baseline. If customer ID coverage is low, report the attributed share rather than claiming the full uplift as proven.
POS Integration and Data Speed Requirements
Every hotel, store, and shopping centre asks the same question. Will my till data reach the dashboard in time to matter?
We have a hospitality solution that integrates Opera Micros with Cisco Meraki, which is one example of a direct POS link worth testing properly rather than accepting on a slide. Whatever your till setup, start by separating two workloads that vendors often blur together.
Two Speeds, Two Jobs
You need a governed warehouse for finance grade historical reporting, and a real time layer for store operations, live dashboards, and alerts. The MinervaDB guide to the modern retail data stack sets a practical target of p95 query latency below 3 seconds for certified warehouse BI queries and below 300 milliseconds for real-time OLAP queries, with five to ten seconds from a point-of-sale transaction to a store dashboard described as routine and certified warehouse marts generally refreshing within 15 to 30 minutes.
| Workload | Query target | Refresh target |
|---|---|---|
| Store operations and dynamic pricing | p95 under 300 milliseconds | 5 to 10 seconds from till to dashboard |
| Certified warehouse BI and store comparisons | p95 under 3 seconds | Marts refreshed every 15 to 30 minutes, daily for campaigns |
| Finance reconciliation | Not latency bound | Daily, with under 0.1% variance |
Those targets come with operating discipline too. Aim for 99.5% monthly pipeline success and less than 0.1% daily reconciliation variance between POS and warehouse, so fast data does not become wrong data.
A Three Step Trial Test
- Record a test transaction: Put through a real sale and note the exact time at the till.
- Time it to the dashboard: Watch when it appears in the store view, not just in a raw feed.
- Repeat at peak: Run it again during your busiest hour and read the p95, not the average.
Averages hide the Saturday afternoon problem. The p95 tells you what your team experiences when concurrent dashboard users pile in and queues build.
Speed also decides whether alerts help. We integrate with the Cisco Meraki MV Sense location analytics API to monitor visitor traffic and set camera threshold alerts sent as text messages via Twilio. A queue alert that arrives after the queue has cleared, or after shoppers have walked away, is just a history lesson. Check our overview of POS and EPOS integration options before your trial so you know which connection method you're testing.
One system rarely serves every workload well. Let the warehouse be right, and let the operational layer be fast.
Captive Portals and Authentication for Guest Wi-Fi
Your captive portal is the moment a visitor meets your brand and your data rules at the same time. Get it wrong and you either collect nothing useful or annoy people before they've even browsed.
Cisco Meraki captive portals can require a username and password before granting access, validated through a Meraki hosted service or your own RADIUS, Active Directory, or LDAP server. That matters because login choice shapes the analytics you'll get later, from anonymous presence to a named, returnable visitor.
RADIUS is where a portal stops being a click-through page. Cisco's captive portal documentation identifies RADIUS as highly recommended and mandatory for features such as internet provisioning, internet denial, session-duration controls, and bandwidth settings. In plain terms, authentication becomes policy enforcement.
| Method | Data captured | Best fit | Trade-off |
|---|---|---|---|
| Click-through terms page | Acceptance only, little identity | Low-friction cafés and quick visits | Minimal data for marketing |
| Social login or social Wi-Fi | Basic profile details from Facebook or Gmail | Retail and hospitality marketing | Some visitors decline to sign in |
| Voucher or access code | Code redemption, sometimes contact details | Exhibitions, concerts and events | Printed codes need handling and tracking |
| IPSK (individual pre-shared key) | One key per user or device, mapped to an identity | Corporate BYOD and student dorms | Key issuance and support overhead |
| EasyPSK | Simplified per-user passphrase onboarding | Education and guest BYOD | Confirm feature scope with the vendor |
| RADIUS or directory login | Directory identity for each user | Corporate staff and managed campuses | Needs directory infrastructure in place |
Matching Method to Sector
Retail and hospitality usually favour social login and social WiFi because visitors understand it and you gain basic profile data with consent. Exhibitions and events often work better with vouchers, since access is temporary and groups arrive in bursts.
Corporate BYOD and student dorms suit IPSK, where each individual pre-shared key can be revoked without changing the password for everyone. We offer an IPSK MDU Solution for multi dwelling properties, and DUO, secure multi-factor authentication for Meraki Wi-Fi, for staff who need a stronger check. EasyPSK is worth asking about as a simplified per user onboarding option, but confirm its exact scope with us before you design around it.
You don't need one login flow everywhere. Cisco Meraki can apply different portal behaviour to different SSIDs or sites, so a campus can run student access on one network and guest social login on another. Our captive portal solutions for Cisco Meraki guest Wi-Fi show how those flows can sit side by side without forcing every visitor through the same door.
I'd keep it simple. Retail wants low friction plus consented identity, events want controlled temporary access, and education and corporate BYOD want per user keys or directory login.
Pricing Models and Visitor Data Ownership
Pricing looks tidy in a quote and messy in year two. The model matters as much as the number.
| Pricing model | How cost scales | Watch for |
|---|---|---|
| Per 100 access points | Steps up in blocks as the AP count grows | Rounding rule and what each block includes |
| Per location | Flat fee per site | Multi-site estates can cost more than they appear |
| Per user or seat | Scales with staff logins | Often a poor fit for guest traffic |
| Per camera or analytics module | Scales with cameras and add-on modules | Licence counts and the cost of extra modules |
| Usage or transaction based | Scales with visits or data volume | Harder to forecast during peak seasons |
Our Advanced Analytics module is optional and is priced per 100 access points. That means a 250 AP estate may be billed in three blocks depending on the rounding rule, so ask for that rule in writing before you budget. Our Assisted IPSK is priced per 100 access points and includes all IPSK features, CSV bulk upload, and bulk QR code printing, which matters when you're onboarding hundreds of students or staff at once.
If you're comparing a volume based quote, it helps to understand how usage based billing software works so you can model a busy December rather than a quiet average month.
Who Owns the Visitor Data
We disclose user data to the owners of the venues where users access our WiFi services, and the venue's own privacy policy governs how that data is used. In most setups, that makes your venue the data controller, which is exactly why ownership wording belongs in the contract, not in a sales call.
Send any vendor these five questions:
- Holder: Who holds the visitor data, and where is it stored?
- Export: Can we export every visitor record if we leave?
- Retention: What are the retention periods for raw and aggregated data?
- Deletion: How are deletion requests handled and evidenced?
- Identifiers: Which identifiers are collected by default, and which are optional?
Our page on data subject rights and how requests are handled gives you a feel for the detail you should expect in those answers.
More identifiable data isn't always better. Aggregation, pseudonymisation, opt in identifiers, and short retention windows often answer most store level questions while lowering legal and trust risk. The governance gap is real, as a 2025 retail and CPG survey on the state of AI found data privacy was a top generative-AI concern for 60% of respondents and 52% considered AI governance very important, yet only 46% had created formal policies aligned with standards and 44% had a framework for ongoing governance improvement. Ask for written retention and deletion procedures before signing, not after your first subject access request.
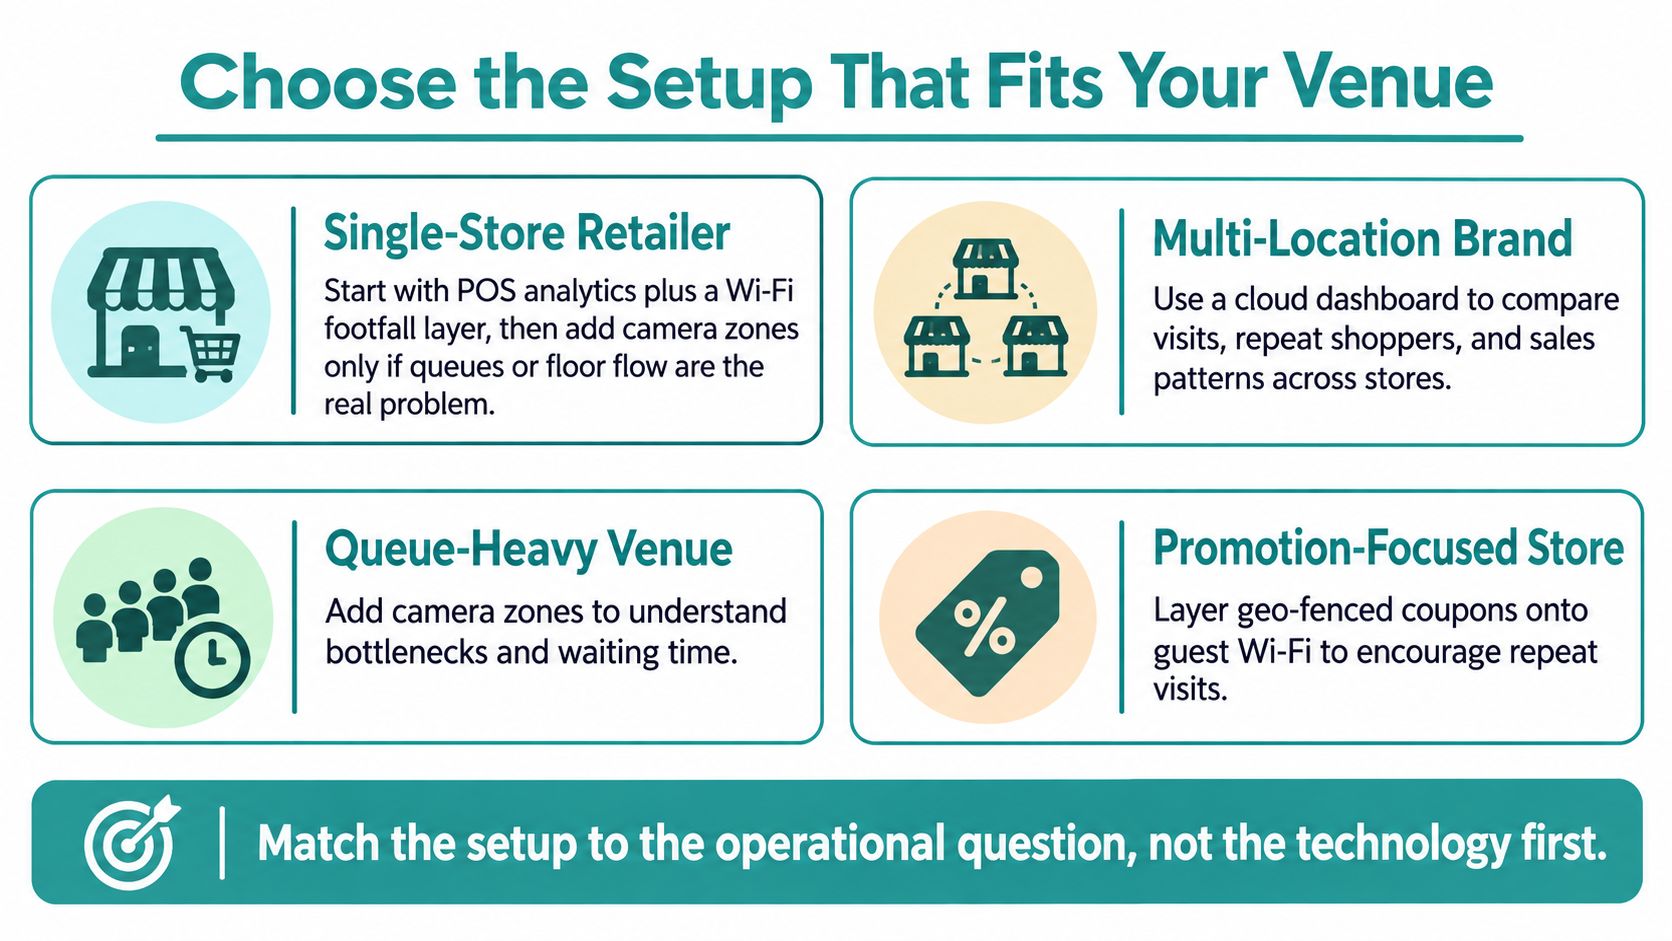
Choose the Setup That Fits Your Venue
There's no single best stack. There's a best fit for the question you're trying to answer and the network you already run.
Four Sensible Starting Points
- Single store retailer: Start with POS analytics plus a Wi-Fi footfall layer. Add camera zones only if queues or floor flow are the main problem.
- Shopping centre: Choose a Wi-Fi platform with cross site zone analytics, geo-fenced coupons, and clear data ownership in the contract.
- Corporate BYOD site: Set authentication first with IPSK or RADIUS, then add analytics second.
- Education campus: Use per student IPSK or RADIUS with campus level policy, so access follows the person, not a shared password.
The Cisco Meraki fit is straightforward. Meraki access points and MV cameras supply the signals, while Splash Access adds the captive portal, IPSK, social login, geo-fenced coupons, Advanced Analytics, and Twilio alerts. We're suited to retail outlets, exhibitions, and concerts, but you should still test us against the same checklist as any other option.
Your Trial Checklist
- POS link tested: A live transaction reaches the dashboard and reconciles.
- Deduplication documented: Visitor counts survive a roam between access points.
- Latency tested at p95: Peak hour performance is measured, not averaged away.
- Authentication matched to sector: Retail, education, events, and BYOD each get the right flow.
- Data ownership in writing: Export, retention, and deletion are in the contract.
I'd start with the cheapest test that proves the signal. Run one store, one zone, or one SSID through a trial, work through the checklist with your own shoppers and staff, and only then talk about rolling out everywhere.
Ready to see what your own footfall, dwell, and return visit data looks like on your Cisco Meraki network? Visit Splash Access to explore our captive portal, IPSK and EasyPSK authentication, social WiFi, and retail analytics options for retail, education, and corporate BYOD, and request a demo you can run against the checklist above.