Ever feel like your Wi-Fi is moving at a snail's pace, especially in a busy store or right in the middle of a crucial video call? Hey, we've all been there! The culprit is often a metric called the Signal-to-Noise Ratio (SNR). It's a surprisingly simple calculation: you just subtract the background noise value from your signal strength (RSSI).
Why SNR is Your Wi-Fi’s Most Important Health Metric
Think of SNR like trying to have a conversation in a loud, crowded restaurant. The "signal" is your friend's voice, and the "noise" is the chatter from everyone else. A high SNR means your friend's voice is coming through loud and clear over the background racket.
This isn't just a technical term for network engineers; it's the single most important factor for a fast, reliable wireless experience for your customers, students, and employees. Whether you’re running a network in the Education, Retail, or a corporate BYOD sector, a strong SNR is absolutely essential for things to run smoothly.
For businesses that rely on the powerhouse combination of Cisco Meraki access points and Splash Access, getting a handle on SNR is the first step toward delivering flawless connectivity. This is especially true in places that depend on solid Authentication Solutions and Captive Portal experiences.
How SNR Directly Impacts Your Users
A poor SNR can completely derail the user experience before it even gets started. Just imagine these real-world situations:
- Guest Wi-Fi: A customer in your cafe tries to use a social login on your guest wifi. But because the signal is weak (low SNR), the portal times out. That’s not just frustrating for them; it's a lost opportunity for you to connect.
- Secure Authentication: In corporate or school environments, secure connections using Authentication Solutions like IPSK or EasyPSK are non-negotiable. A weak signal-to-noise ratio is a primary cause of authentication failures and maddening, constant disconnects.
- High-Density Areas: Picture a busy retail center on a weekend or a packed university lecture hall. Hundreds of devices are all fighting for airtime. A high SNR is what allows your network to cut through the chaos and handle that load without grinding to a halt.
A stable, high-quality Wi-Fi connection isn't a luxury anymore—it's a baseline expectation. For any organization managing a wireless network, SNR is the foundational metric that dictates whether your users have a great experience or a frustrating one. You can learn more by reading about improving Wi-Fi performance in our detailed guide.
In the fast-paced world of hospitality, where Splash Access provides seamless guest Wi-Fi using Cisco Meraki access points, calculating SNR is a critical daily task. Modern statistical methods have become so precise they can estimate high-frequency noise with mean absolute errors as low as 0.5 dB—a massive leap from older techniques. This kind of accuracy is what allows Meraki APs to handle things like WPA2 authentication without dropping connections.
Finding Your Key Numbers: RSSI and Noise Floor
Before you can get to the SNR calculation, you first need to find two critical values: the signal strength (RSSI) and the background interference (the Noise Floor). Think of them as the two essential ingredients for our Wi-Fi health recipe. Let's break down what they mean in a practical sense.
Received Signal Strength Indicator (RSSI) is all about how well a device—say, a student's laptop in an Education setting or a shopper's smartphone in a Retail store—can "hear" the signal coming from an access point. We measure this in negative decibel-milliwatts (-dBm). It might seem a little backward at first, but a number closer to zero, like -55 dBm, is actually a much stronger signal than one further away, like -80 dBm.
The Noise Floor, on the other hand, is all the unwanted background chatter your Wi-Fi signal has to compete with. This ambient noise comes from all sorts of things: other electronics, neighboring Wi-Fi networks, even a microwave oven firing up in the breakroom. It's the constant static that your signal must rise above to be clearly understood.
This simple flowchart shows how these pieces fit together to determine your SNR.
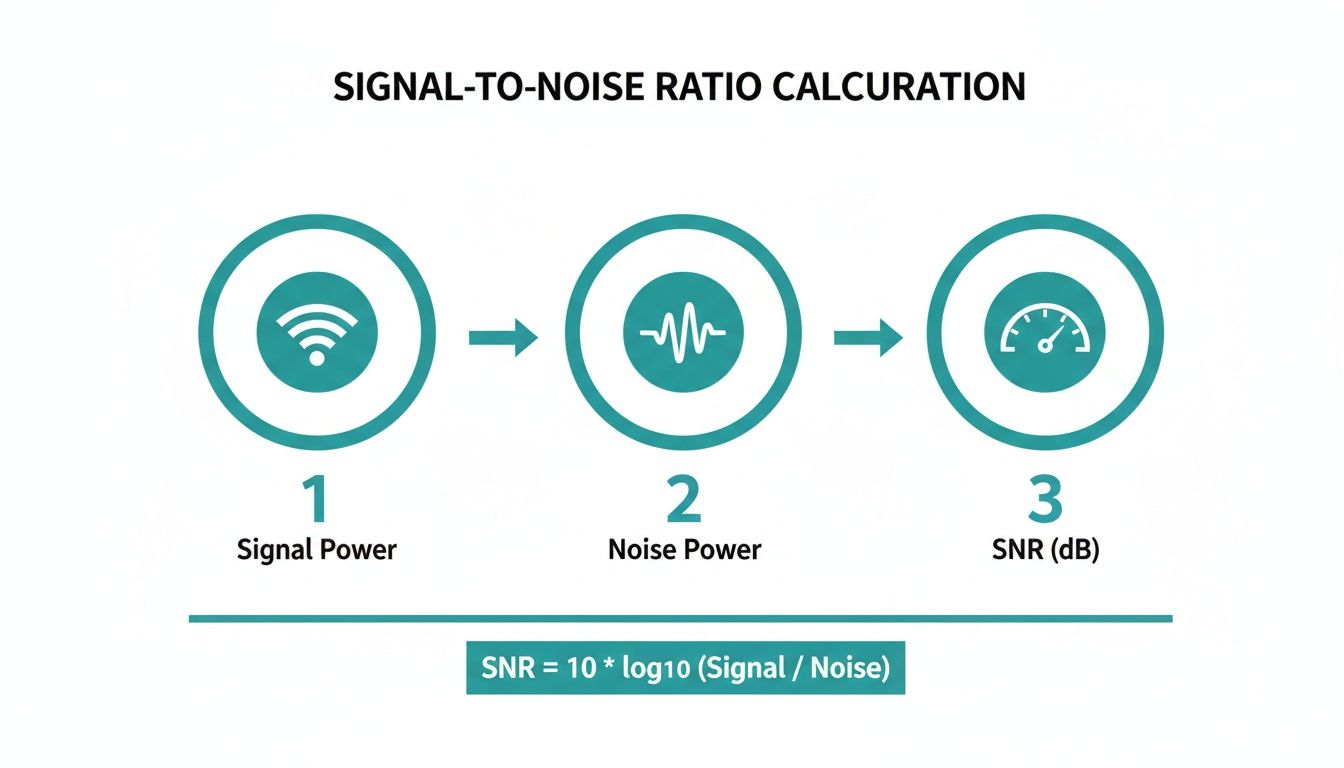
As you can see, the signal needs to be significantly stronger than the noise to give you a healthy SNR, which the gauge on the right visualizes perfectly.
Uncovering Your Data in the Meraki Dashboard
If you’re managing a Cisco Meraki network, you're in luck. Finding this data is incredibly straightforward right from the dashboard. It serves up a ton of information about client connectivity, including real-time RSSI values. You can drill down and see the signal strength for individual devices, which is a lifesaver for diagnosing specific user complaints in a corporate BYOD environment or a busy Retail setting.
Pinpointing your Wi-Fi's RSSI and noise floor is the first, crucial step. This is fundamental to the broader process of collecting and analyzing data that underpins any real performance improvement.
Getting this right is especially important for Education institutions and corporate offices that use Splash Access for guest networks with authentication like IPSK. Understanding these numbers is the key to creating a stable wireless environment.
Whether you're setting up a robust Captive Portal with social login for a Retail store or ensuring seamless connections in a university lecture hall, it all starts with these two values. For a much deeper dive into assessing your physical environment, conducting professional wireless site surveys is an invaluable next step.
Calculating SNR With a Simple Formula
Alright, let's get down to brass tacks. You don't need to be a radio frequency engineer to figure out your network's SNR. In fact, the formula is refreshingly simple and gives you a powerful diagnostic number in just a few seconds.
Here’s the only formula you need to remember:
SNR (dB) = RSSI (-dBm) – Noise Floor (-dBm)
You just subtract the noise floor from your signal strength (RSSI). Since both values are negative, what you're really doing is finding the difference between them. It’s that straightforward.
Getting this calculation right is the key to ensuring your Authentication Solutions work flawlessly. Whether you're running a social wifi login for a Retail store or a secure EasyPSK setup for corporate BYOD, a healthy SNR means a stable connection. And a stable connection is the bedrock of a great user experience.
Real-World Calculation Examples
Theory is one thing, but let's see how this plays out in the real world with a few common scenarios.
-
Education Sector: Picture a student's laptop in a university dorm. Their device shows a signal strength (RSSI) of -65 dBm. The background chatter from other networks, microwaves, and devices creates a noise floor of -90 dBm.
- Calculation: -65 dBm – (-90 dBm) = 25 dB SNR
- This is a good, solid SNR. It's more than enough for streaming lectures, collaborating on projects, and online research without frustrating drops.
-
Retail Environment: Now, think about a shopper's phone in a crowded mall. Their signal is weaker at -75 dBm, and the noise floor is a loud -85 dBm thanks to interference from dozens of other stores' Wi-Fi, security tags, and Bluetooth devices.
- Calculation: -75 dBm – (-85 dBm) = 10 dB SNR
- This is a very poor SNR. That user is going to have a bad time. They'll probably struggle to connect to your guest wifi, and your Captive Portal will feel sluggish or fail to load entirely.
A low SNR often points to channel congestion. Getting a handle on your RF environment is crucial. For a deeper dive, understanding Wi-Fi channel width can offer some powerful optimization strategies.
- Corporate BYOD: An employee in a well-planned corporate office has a strong RSSI of -60 dBm and a very quiet noise floor of -92 dBm.
- Calculation: -60 dBm – (-92 dBm) = 32 dB SNR
- This is an excellent SNR. Their IPSK authentication will be seamless, and they can expect crystal-clear video calls and fast file transfers.
By running these simple calculations, you can quickly assess the health of your wireless network using the tools already built into your Cisco or Meraki dashboard.
Turning SNR Data Into a Better Wi-Fi Experience
Knowing your network's Signal-to-Noise Ratio is one thing; using that data to actively improve your Wi-Fi is where the real magic happens. Great SNR across your entire space isn't an accident. It's the result of smart planning and ongoing adjustments that turn raw numbers into a fantastic user experience.
Imagine a busy Retail store. You've got security systems, payment terminals, and a dozen neighboring networks all creating interference. By strategically placing your Cisco and Meraki access points, you can cut through that noise. This ensures that features like geo-fenced coupons delivered via Splash Access actually reach your customers' phones, providing a smooth digital experience that keeps them engaged.
Real-World Optimization in Action
In an Education setting, a high SNR is non-negotiable. Picture a lecture hall where hundreds of students are hitting a Captive Portal at the same time. An IT admin can dive into the Meraki dashboard, analyze the SNR data, and tweak the channel plan to ensure the network doesn't buckle under that immense load.
The same goes for corporate BYOD environments, where a solid SNR is the backbone of security and productivity. Stable connections are essential for secure Authentication Solutions like IPSK and EasyPSK to work properly, preventing those frustrating authentication loops and random dropouts. More importantly, it means no more frozen faces during a critical video call.
A proactive approach to network health is always better than a reactive one. Regularly monitoring SNR allows you to spot and fix potential weak spots before your users even notice a problem, turning your Wi-Fi from a source of complaints into a reliable asset.
The Meraki dashboard is fantastic for this, with powerful visualization tools like the Wireless Health page that help you quickly identify areas with poor SNR.
This single screen gives you an at-a-glance summary of connection quality, making it incredibly easy to see which clients or access points are struggling with a low SNR. You can use this insight to focus your troubleshooting efforts where they'll have the most impact.
Actionable Steps for a Stronger Connection
So, how do you put all this theory into practice? It really boils down to two key areas: where you put your access points and how you manage your channels.
- AP Placement is Everything: Physical barriers are your signal's worst enemy. Concrete walls, metal shelving, and even large crowds of people can absolutely kill your Wi-Fi. A thoughtful access point design ensures your signal has the clearest possible path to user devices.
- Be Smart About Channel Management: In crowded spaces, co-channel interference is a massive source of noise. Use built-in tools to find the least congested channels and either assign them manually or let a feature like Meraki’s Auto RF handle the heavy lifting.
- Tweak Your Power Levels: It's tempting to crank the power on all your APs to the max, but that's often a mistake. Sometimes, reducing the power on an AP can shrink its cell size, which in turn reduces interference with its neighbors and improves overall performance for everyone.
For businesses in Retail and healthcare that rely on Splash Access for features like geo-fenced coupons or Opera Micros integration, getting these SNR calculations right is crucial. Remember, even a small drop can have a big impact—an SNR below 10 dB can slash Wi-Fi throughput in half. When you optimize your network based on solid data, every user, from a guest using a social login to an employee on a secure network, gets the five-star connection they expect.
Using SNR to Troubleshoot Common Wi-Fi Problems
Hearing complaints about slow or unreliable Wi-Fi? Before you start rebooting access points, the first thing you should check is the Signal-to-Noise Ratio. A low SNR is the classic culprit behind a huge range of wireless headaches, from dropped connections in a lecture hall to painfully slow downloads at a coffee shop.
Think of SNR as your first-response diagnostic tool. It helps you cut through the noise—literally—and figure out what's really going on.

We’ve all seen those frustrating, real-world scenarios. There's always that one conference room where video calls constantly freeze, or a specific corner of the Retail floor where payment terminals lose connection. Maybe you've dealt with a user whose laptop drops from the network for a few minutes and then mysteriously reconnects. These are textbook cases where a quick SNR check can point you directly to the root cause.
One of the most common and confusing issues I see is when a user's device shows full Wi-Fi bars (a strong RSSI) but their connection is still terrible. This almost always screams "high noise floor." The signal is plenty loud, but the background chatter is even louder, leading to a poor SNR.
Pinpointing the Real Problem
A low SNR value is a symptom, not the disease. Your job is to play detective and trace it back to the source. This is where combining your on-the-ground SNR readings with the analytics in your Cisco Meraki dashboard becomes incredibly powerful for pinpointing the culprit.
So, what are the usual suspects behind a poor SNR?
- Co-Channel Interference: This is a massive issue in dense environments like shopping centers, apartment complexes, or multi-tenant office buildings. When too many nearby networks are all shouting on the same Wi-Fi channel, it creates a chaotic and noisy environment for everyone.
- Physical Obstructions: Never underestimate physics. Thick concrete walls, metal shelving in a stockroom, or even a large crowd of people can absorb, reflect, and just plain kill Wi-Fi signals, degrading their quality.
- Outdated Device Drivers: Sometimes, the network is fine—it's the client device that's the problem. An old, buggy, or faulty wireless driver can make a device perform poorly even on a perfectly healthy network.
By systematically checking SNR in problem areas, you can quickly narrow down the possibilities. For instance, is the SNR low for all devices in one location, or is it just affecting a single user? The answer immediately tells you whether to start investigating an access point or that person's specific device.
This diagnostic process is crucial for keeping your business-critical systems online. A stable connection is essential for everything from your guest wifi portal to the Authentication Solutions layered on top of it, like social login or secure IPSK for corporate users bringing their own devices (BYOD). A bad connection means a failed login, which directly translates to a poor customer experience or a hit to employee productivity.
When Wi-Fi issues start impacting the bottom line, professional remote IT support can be a huge help in diagnosing and resolving these tricky connectivity problems.
Ultimately, tackling these issues often comes down to actively managing your RF environment. For a much deeper dive, check out our guide on interference with Wi-Fi. It's packed with practical strategies for creating a cleaner, more reliable wireless space.
Your Top Wi-Fi SNR Questions, Answered
We’ve walked through the nuts and bolts of calculating the signal-to-noise ratio. But as any network pro knows, theory is one thing—the real world is another. Let's dig into some of the most common questions that come up when you start applying this on the ground.
What SNR Value Should I Be Aiming For?
For the best possible performance, you really want to see an SNR of 25 dB or higher. That’s the gold standard for buttery-smooth video calls, quick file transfers, and a connection that just works.
If you’re seeing numbers between 20-25 dB, things are probably okay for lighter tasks like web browsing or checking email. But once you drop below 20 dB, you can bet your users are starting to feel the pain—think choppy calls and slow-loading pages.
In really demanding spaces—like a busy university campus (Education), a packed Retail store, or a corporate office with a heavy BYOD policy—I always recommend aiming for 30 dB or even more. It builds in the headroom you need to keep everyone happy and productive.

Can I Actually Improve My SNR Without Buying New APs?
Yes, you absolutely can. Before you start planning a hardware refresh, there are a few tried-and-true tricks you can use with your existing Cisco or Meraki network that often make a world of difference.
- Go on an interference hunt. The first step is to find and move any obvious sources of RF noise. I'm talking about things like microwave ovens in a breakroom, old cordless phone base stations, or even poorly shielded AV equipment. Getting them physically away from your access points can work wonders.
- Find a quieter channel. Hop into your Meraki dashboard and take a hard look at the channel utilization graphs. If an AP is sitting on a crowded channel, it's constantly fighting for airtime. Manually moving it to a less congested channel can instantly lower the noise floor and boost your SNR.
- Rethink your AP placement. You'd be amazed what moving an access point just a few feet can do. Getting it out from behind a concrete pillar, away from a large metal filing cabinet, or down from a ceiling cavity can dramatically improve signal clarity.
How Does SNR Impact My Guest Wi-Fi and Captive Portal?
For a guest wifi network, SNR is everything. When a customer or visitor tries to log on, a low SNR can make your Captive Portal or social login page load at a snail's pace—if it loads at all. That initial connection is your first impression, and a bad one creates immediate frustration.
This is especially true for businesses in Retail or hospitality that rely on Authentication Solutions like Splash Access to offer social wifi or collect valuable customer insights. If the connection is shaky, the entire process falls apart. It doesn't matter how great your portal looks if users can't connect to it. A solid signal with a high SNR is the foundation for any successful guest Wi-Fi experience, from IPSK to EasyPSK.
A strong signal is the first and most important step to a successful guest Wi-Fi program. If the connection isn't reliable, none of the advanced features—from data capture to location analytics—can function properly.
What’s the Real Difference Between SNR and RSSI?
This is a great question, and it trips a lot of people up. The easiest way to think about it is with an analogy.
Received Signal Strength Indicator (RSSI) is all about volume. It tells you how loud the Wi-Fi signal is by the time it gets to your device. It’s like measuring how loud someone is talking.
Signal-to-Noise Ratio (SNR), on the other hand, is all about clarity. It measures how loud that voice is compared to all the background noise in the room. You could have someone shouting (a strong RSSI), but if you’re in the middle of a rock concert (a high noise floor), you still won’t understand them. The SNR would be terrible.
A great Wi-Fi connection needs both: a strong signal (good RSSI) and a clear one (high SNR).
Ready to provide a world-class Wi-Fi experience for your guests, students, or employees? Splash Access integrates seamlessly with Cisco Meraki to deliver powerful, customizable captive portals and authentication solutions. Discover how we can help you turn your Wi-Fi into a powerful asset today.


